


Economic Summary
This week's economic data showed overall positive results with the outlier being the continued deterioration in consumer sentiment.
Consumer Sentiment
The University of Michigan released the final results of its April survey of consumer sentiment. The Consumer Sentiment index fell from 53.3 in March to 49.8 in April. The Current Conditions sub-index fell from 55.8 to 52.5 and the Future Expectations sub-index fell from 51.7 to 48.1.
Housing
Pending home sales slowed slightly from +1.7% in February to +0.7% in March. The average 30-year mortgage rate fell from 6.42% to 6.35% last week. Weekly mortgage applications rose 7.9% this week. Applications to purchase a house led the increase as they rose 10.1% while applications to refinance rose 5.8%.
Jobs
Initial jobless claims remained with the 200,000 to 250,000 range even though initial claims rose 6.000 to 214,000 last week. Continued claims rose 12,000 to 1,821,000.
Manufacturing
S&P Global's Manufacturing Purchasing Managers Index rose from 52.3 in March to 54.0 in April. the Kansas City Federal Reserve's manufacturing activity index slipped from +11 to +10.
Retail Sales
Retail sales rose 1.7% in March compared to 0.7% in February. Before we get too excited it is important to remember that Retail Sales are not inflation adjusted. As a result, most of the increase was due to inflation rather than more items purchased. To highlight this, gasoline sales rose 15.5%. We all know how much gas prices rose in March due to the surge in oil prices.
Service Sector
S&P Global's Service Sector Purchasing Managers Index rose from 49.8 in March to 51.2 in April.
Perspectives
Soundbite
The takeaways are as follows.
-
Since 3/31/21 regional inflation has moved through four phases.
-
Phase 1: The synchronous surge phase from the Spring of 2021 through the Summer of 2022.
-
Phase 2: The synchronous swoon phase from the Summer of 2022 through the Summer of 2023 .
-
Phase 3: The “let's go our separate ways” phase from the Summer of 2023 through the end of 2025.
-
Phase 4: The “is it the beginning of another swing higher?” phase from the end of 2025 to now (3/31/26).
-
-
Inflation is a regional story on top of an individual item story. As a result, it matters where you live along with what you buy.
Analysis
The Census Bureau divides the US into nine divisions: New England, Middle Atlantic, South Atlantic, East North Central, West North Central, East South Central, West South Central, Mountain, and Pacific. Details of which states comprise each Census Bureau division are at the bottom of the Analysis section.
Let us start by examining the historical year-over-year inflation rate from 3/31/21 through 3/31/26. The chart below highlights four phases of inflation trends during this period. Phase 1 can be characterized as the synchronous surge phase from the Spring of 2021 to the Summer of 2022. All divisions saw a surge in inflation after the end of the pandemic crisis caused by fiscal and monetary policy stimulus creating excess demand for goods and services compared to the supply available. The spike reached its peak during the summer of 2022. As you can see in the chart below, all regions moved higher in sync, but the magnitude of the surge varied by division. The peak difference was 3.1 percentage points with the West South Central division at 10.6% and the Middle Atlantic division at 7.3%.
Phase 2 was the synchronous swoon phase. A sustained decline in the year-over-year inflation rate occurred between the Summer of 2022 through the Summer of 2023. Once again, all divisions moved lower in sync, but the magnitude again varied but narrowed.
Phase 3 was the “let's go our separate ways” phase that lasted from the Summer of 2023 until the end of 2025. During this phase, the divisional moves were not in sync. There was no clear trend other than a trend of variation as some divisions saw declines when others were rising and the other way around through this period. During this period there were only two divisions where the year-over-year inflation rate broke below the Federal Reserve's 2.0% target rate (West South Central and Mountain). Overall, this period saw inflation fluctuate between the range of 2% to 4%.
Phase 4 remains to be fully defined. Right now it can be characterized as the "is it the beginning of another swing higher?” phase. Since the end of the year, four divisions have seen consistent moves higher, two states were stable for two months and then moved higher in March and three states moved lower in February and then higher in March. All states now have a year-over-year inflation rate that is higher than the end of 2025. The magnitude of difference has also narrowed to 1.1 percentage points.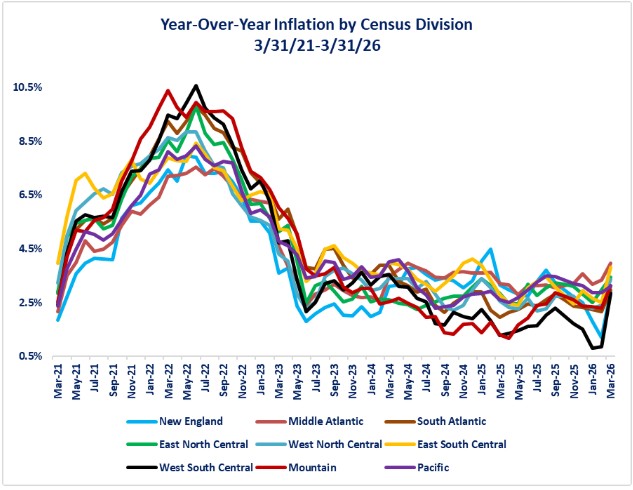
Since we have examined the movement of regional inflation, now, let us examine the percentage point change between years. this is a way of quantifying the changes in year-over-year inflation between years. The blue bars in the graph below highlight that during Phase 1, even though the West South Central division experienced the highest year-over-year inflation rate at 10.6%, the biggest percentage point increase in the inflation rate between 3/31/21 to 3/31/22 was the Mountain division. Its year-over-year inflation rose 7.9 percentage points while the East South Central division had the lowest increase at 3.9 percentage points. During Phase 2, the West South Central division had the biggest percentage point decline at 8.7 percentage points. The Middle Atlantic division experienced the smallest decline at 4.1 percentage points. During the next three years, inflation steadily decreased, but by a small amount, as each year progressed. During the past year (3/31/25-3/31/26) all divisions flipped back to a positive increase except the New England division. The Mountain division has experienced the biggest percentage point increase at 1.8 percentage points while the New England division experienced a 0.3 percentage point decrease. What this graph highlights are that the divisions move in the same direction, but the magnitude of move is clearly different. Different factors in each division impact the change in inflation. Each division has different local cost pressures, especially in services, housing-related categories, and shipping expenses that impact the magnitude of moves in inflation.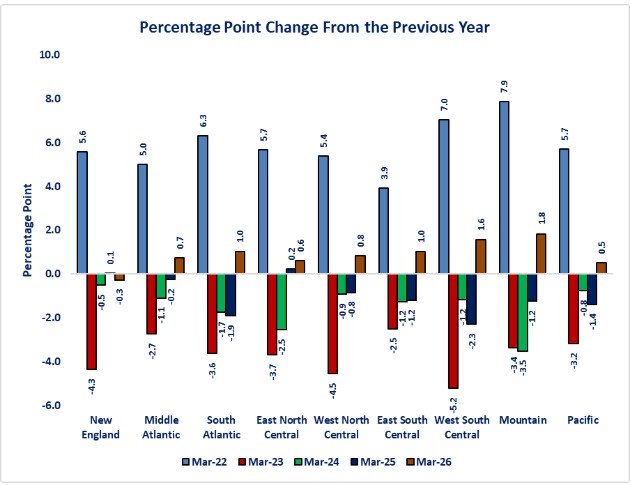
Next, let us examine the cumulative percentage point change in the year-over-year inflation rate since 3/31/21. This is the net change from 3/31/21 to 3/31/26. Keep in mind that because inflation rose and fell, the cumulative impact is the net result of all the movement. Examining the chart below highlights the longer-term difference in inflation between regions compared to monthly or yearly results. What the graph shows is that for all divisions except the East South Central division, inflation is higher than 3/31/21. The Middle Atlantic (1.8%) and New England (1.1%) divisions experienced the “hottest” inflation while the East South Central (-0.1%) showed the “coolest” inflation. What that means is that, compounded over the full period, the cost of living has risen roughly 22% to 26% across the nine divisions. 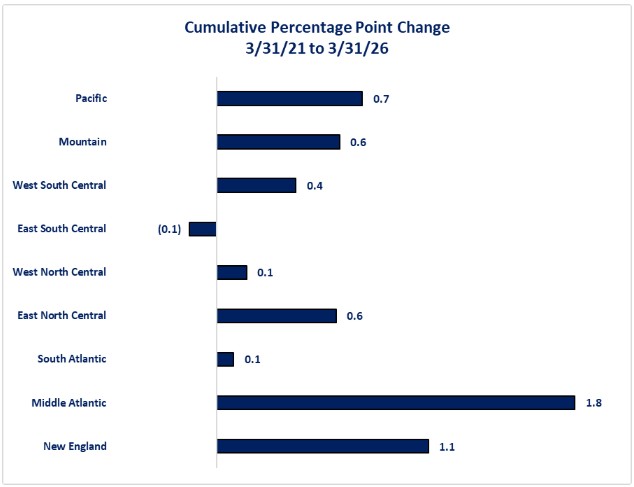
Finally, let us examine where each division currently stands, based on the March CPI report. What we see from the chart below is that not only did the Middle Atlantic division suffer the biggest cumulative percentage point change (1.1%) it also has the highest current year-over-year inflation rate. Even though the East South Central division had a negative cumulative change (-0.1) it still has the second highest inflation rate. The West South Central division has the lowest year-over-year inflation rate. All but two divisions have inflation rates at 3.0% or higher and the other two divisions are close to 3.0%. Those are all levels that are essentially 1% or more from the Federal Reserve's target of 2.0%. We will need to monitor the changes that may occur the longer the war continues.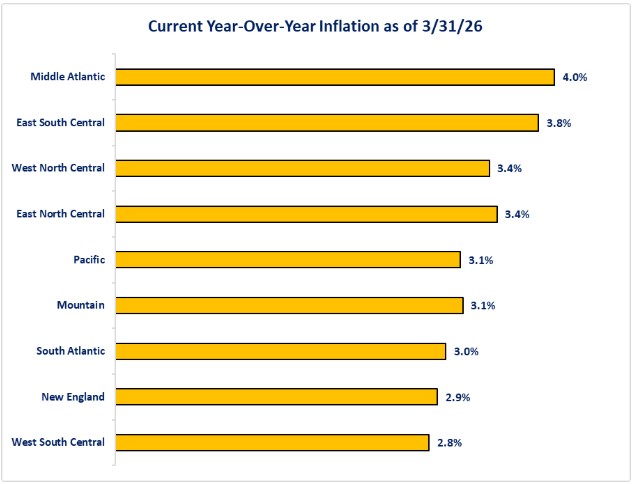
Conclusions
-
Even though all nine divisions moved in sync during the rise and fall of inflation, there were clear differences in the magnitude of the moves and the actual levels of inflation. Various regional cost differences including, but not limited to costs for social services, housing, and shipping affected each region differently.
-
What may be missed in evaluating the patterns of inflation is the fact that prices have not come down.
-
Falling inflation looks great on a graph but falling inflation simply means that, although prices are rising at a slowing pace, they are still rising. If your income is not rising at the same or faster pace, then inflation is eating away at your purchasing power.
-
This means that for many businesses and consumers the damage from the surge in inflation was not reversed. Falling prices are deflation and that has not occurred and may not occur unless a recession hits.
-
For perspective, through the swings in inflation since 2021, the average inflation rate from 3/31/21 to 3/31/26 is over 4% for all divisions.
-
-
Even though the pace of inflation has slowed, all divisions are currently still experiencing inflation rates that are above the Federal Reserve's 2.0% target. It remains to be seen what the full impact of the war on Iran will have for the inflation rate.
-
Inflation is a regional story on top of an individual item story. As a result, it matters where you live along with what you buy in determining your personal inflation rate.
States Included in Each Census Bureau Division
New England
Connecticut, Maine, Massachusetts, New Hampshire, Rhode Island, Vermont
Middle Atlantic
New Jersey, New York, Pennsylvania
South Atlantic
Delaware, Florida, Georgia, Maryland, North Carolina, South Carolina, Virginia, West Virginia
East North Central
Illinois, Indiana, Michigan, Ohio, Wisconsin,
West North Central
Iowa, Kansas, Minnesota, Missouri, Nebraska, North Dakota, South Dakota
East South Central
Alabama, Kentucky, Mississippi, Tennessee
West South Central
Arkansas, Louisiana, Oklahoma, Texas
Mountain
Arizona, Colorado, Idaho, Montana, Nevada, New Mexico, Utah, Wyoming
Pacific
Alaska, California, Hawaii, Oregon, Washington
Disclosures

Steve is the Economist for Washington Trust Bank and holds a Chartered Financial Analyst® designation with over 40 years of economic and financial markets experience.
Throughout the Pacific Northwest, Steve is a well-known speaker on the economic conditions and the world financial markets. He also actively participates on committees within the bank to help design strategies and policies related to bank-owned investments.