


Perspectives.
Last week we examined trends in the manufacturing industry related to production. This week takes a deeper dive into manufacturing jobs to help us understand which manufacturing industries are adding jobs (if any) and which are losing jobs.
Soundbite.
Your view on the health of the manufacturing industry depends on whether you are considering production or jobs. As we learned last week, when viewed from what the industry is producing (i.e., orders and shipments) the overall industry is producing and shipping more than it did thirty years ago. What we learned this week is that when viewed from jobs being created, the story is far different. Overall, the manufacturing sector has lost jobs over the past thirty years even though orders and shipments are higher. This means that the manufacturing industry has become more productive and is producing more with fewer people.
Based on history, the one thing that we can be assured of is that change will continue to occur. New manufacturing industries will rise, and older industries may disappear. If the US wants to be a dominant force in manufacturing, the key will be to identify and encourage growth in the new manufacturing industries. That means taking the steps necessary to develop a labor force suited to fill the new jobs that will be created.
Disclosures.
-
The data comes from the Bureau of Labor Statistics.
-
The data is as of 3/31/25.
-
As weird as many of them may seem, the industry categories are what is reported by the Bureau of Labor Statistics.
Observations.
Let us start by examining the landscape for jobs by industry sector.
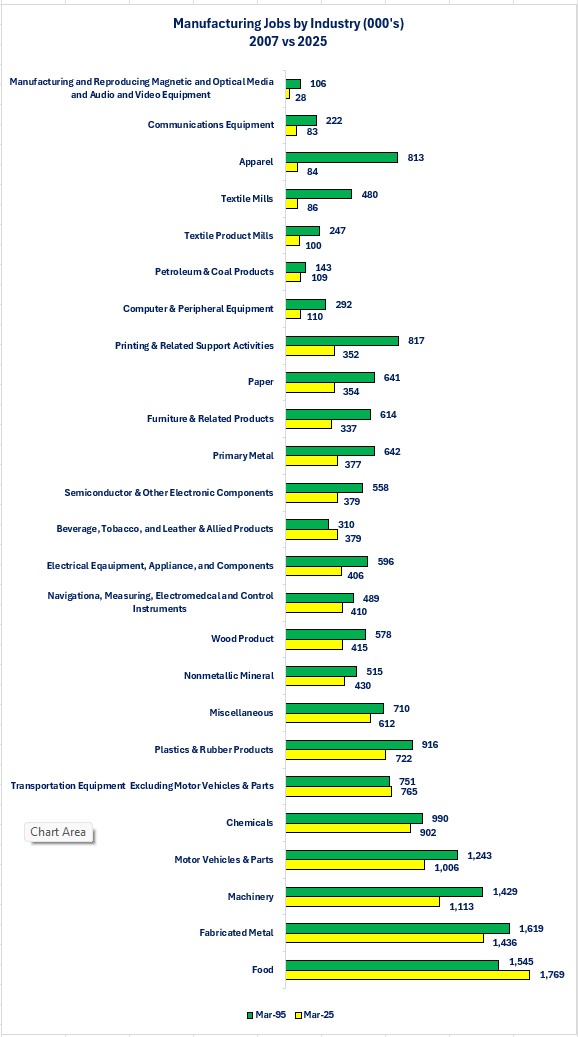
Manufacturing Jobs by Industry-
Only three manufacturing industries experienced an increase in the number of jobs in 2025 compared to 1995.
-
Beverage, Tobacco, and Leather & Allied Products
-
Food
-
Transportation Equipment Excluding Motor Vehicles & Parts
-
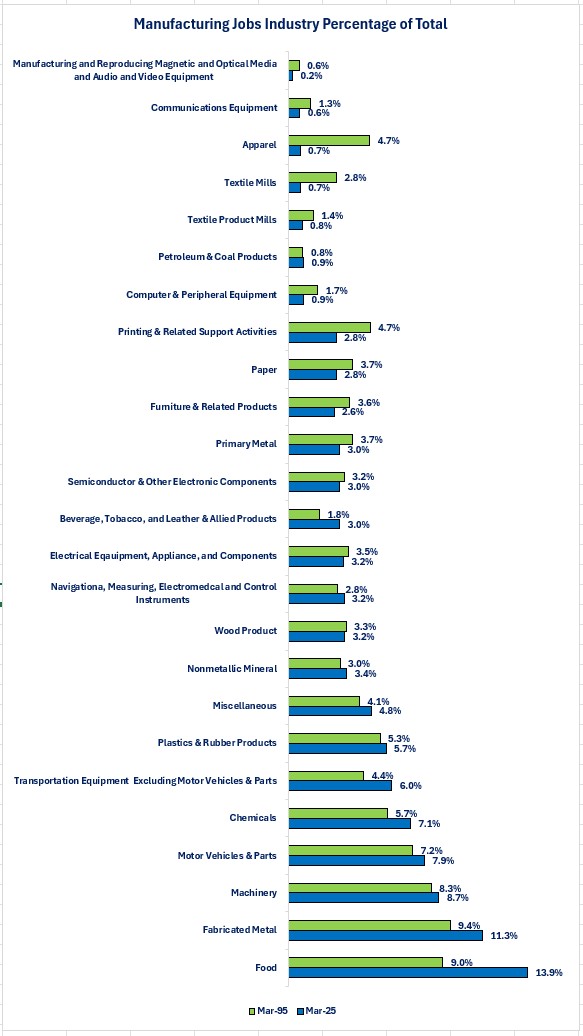
Now, let us examine each industry as a percentage of total manufacturing jobs and compare the 2025 versus 1995.
Manufacturing Jobs by Industry as a Percentage of Total-
Nine of the manufacturing industries saw an increase in the percentage of total jobs in 2025 compared to 1995.
-
The gains of the nine industries came at the expense of the remaining manufacturing industries as the remaining industries saw their percentage of total jobs decline.
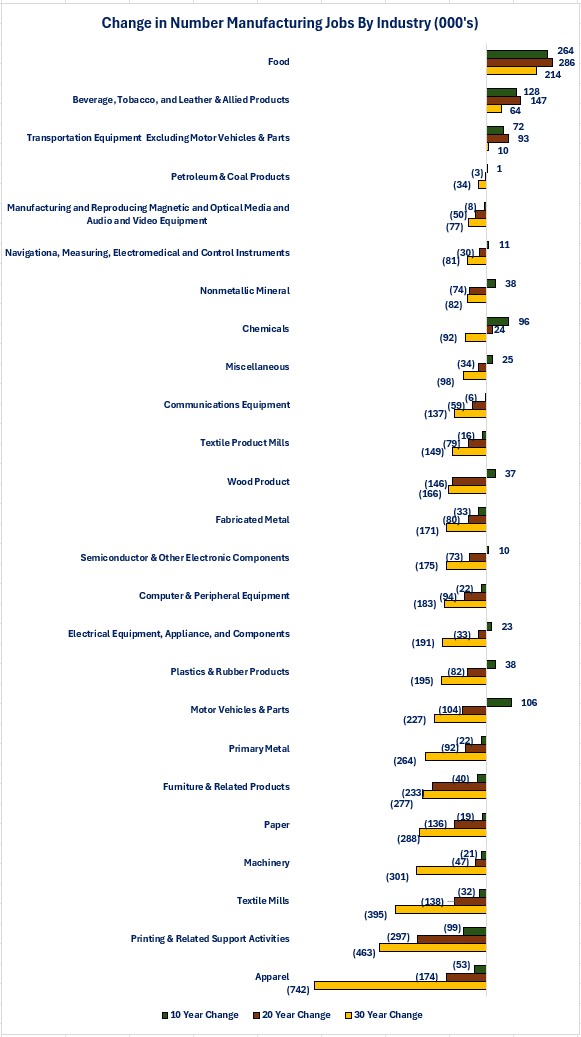
To gain a better perspective on the changes happening in manufacturing jobs, let us examine the change in the number of jobs for each industry sector over the last ten, twenty, and thirty years.
Change in Number of Manufacturing Jobs by Industry-
Only three industries show gains over the past ten, twenty, and thirty years.
-
Beverage, Tobacco, and Leather & Allied Products
-
Food
-
Transportation equipment Excluding Motor Vehicles & Parts.
-
-
One industry experienced a gain in jobs over the past twenty years but saw declines for the ten and thirty years.
-
The results are a little more encouraging over the past ten years. Nine industries experienced gains over the past ten years but declines over the twenty and thirty years.
-
Petroleum & Coal Products
-
Navigations, Measuring, Electromedical and Control Instruments
-
Nonmetallic Metals
-
Miscellaneous
-
Wood Products
-
Semiconductor & Other Electronic Components
-
Electrical Equipment, Appliance and Components
-
Plastics and Rubber Products
-
Motor Vehicle Parts
-
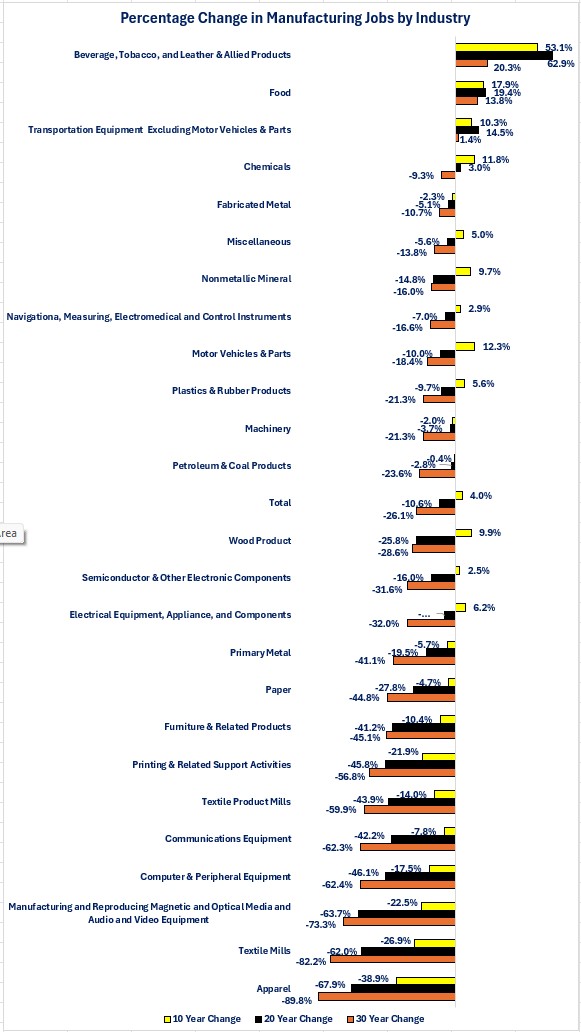
The last perspective to consider is the percentage change in the manufacturing industry jobs. As a reminder, industries with a small number of jobs can see larger percentage changes compared to industries with a larger number of jobs.
Percentage Change in Manufacturing Jobs by Industry.-
The Beverage, Tobacco, and Leather & Allied Products industry experienced the largest percentage gains over the past ten, twenty and thirty years.
-
An increase of 53.1% over ten years.
-
An increase of 62.9% over twenty years.
-
An increase of 20.3% over thirty years.
-
-
The Apparel industry suffered the largest percentage decreases over the past ten, twenty and thirty years.
-
A decrease of 38.9% over ten years.
-
A decrease of 67.9% over twenty years.
-
A decrease of 89.8% over thirty years.
-
Closing thoughts.
- The jobs story for manufacturing is clearly different than the production story.
-
Only three industries show growth in jobs over the past ten, twenty and thirty years and the US has lost over four million jobs in manufacturing.
-
-
If you were just looking at the data, you may not think changes matter that much for industries that have a small percentage of the overall manufacturing jobs.
-
For cities and towns that have those industries and jobs, those changes can be devastating.
-
When you consider the fact that there are seven industries that have lost over 50% of the jobs that existed in 1995, that matters for the cities, towns and employees that had those industries and jobs.
-
-
As technology drives changes in the US and global economy, new types of manufacturing industries will arise.
-
The key for those cities and towns that are losing the old manufacturing industries and the employees who are losing their old manufacturing jobs is whether they can adapt and attract the new industries and learn the new jobs that will arise.
-
-
If the US wants to be a dominant force in manufacturing, perhaps the key will be to identify and encourage growth in the new manufacturing industries versus trying to bring back old manufacturing industries.
-
If that proves true, then it will also be key to take the steps necessary to develop a labor force suited to fill the new jobs that will be created.
-
Educating the younger generations on the benefits of working in these industries.
-
Cross training displaced workers from the old industries to fill the new industry jobs.
-
-
Economic data.
|
Economic Data |
Period Being Reported |
Current Results |
Previous Results |
Comments |
|
4/21/25 |
|
|
|
|
|
Leading Indicators Monthly Change |
March |
-0.7% |
-0.2% |
The index declined further in March as the sentiment components deteriorated further. |
|
4/22/25 |
|
|
|
|
|
Richmond Federal Reserve Manufacturing Activity Index |
April |
-13 |
-4 |
Activity declined further in April. |
|
4/23/25 |
|
|
|
|
|
MBA Mortgage Applications Weekly Change |
4/18/25 |
-12.7% |
-8.5% |
Rising interest rates slowed mortgage activity. |
|
4/18/25 |
-6.7% |
-6.0% |
Purchase activity slowed as interest rates rose. |
|
4/18/25 |
-20.2% |
-12.7% |
Refinancing activity slowed even further as interest rates rose. |
|
4/18/25 |
6.90% |
6.81% |
Mortgage rates rose as long-term US Treasury rates rose. |
|
S&P-Global Composite PMI |
April |
51.2 |
53.2 |
The decline in the composite index was due to a decline in the service sector index. |
|
April |
50.7 |
50.2 |
Activity remained positive and rose slightly. |
|
April |
51.4 |
54.4 |
Activity slowed in the service sector. |
|
New Home Sales Monthly Change |
March |
7.4% |
3.1% |
The increase in home sales was centered in the South as sales rose 13.6% in the south. |
|
4/14/25 |
|
|
|
|
|
Chicago Federal Reserve National Activity Index |
March |
-0.3 |
+0.24 |
The index fell back into negative growth territory. |
|
Initial Jobless Claims |
4/18/25 |
216,000 |
222,000 |
Initial jobless claims remain range bound. |
|
Continuing Jobless Claims |
4/12/25 |
1,841,000 |
1,878,000 |
Continuing claims fell by 37,000. |
|
Existing Home Sales Monthly Change |
March |
-5.9% |
+4.4% |
Sales declined in March. |
|
Durable Goods Orders Monthly Change |
March |
+9.2% |
+0.9% |
The increase was all due to a surge in orders in the Transportation category. |
|
March |
0.0% |
+0.7% |
Orders were unchanged when you exclude Transporation orders. |
|
Kansas City Federal Reserve Manufacturing Activity Index |
April |
-5 |
+1 |
Manufacturing activity declined in the Kansas City region. |
|
University of Michigan Consumer Sentiment Index |
April |
50.8 |
57.0 |
Sentiment has clearly fallen since the tariff uncertainty has hit. |
|
April |
56.5 |
63.8 |
Consumers are far less optimistic about their current situation. |
|
April |
47.2 |
52.6 |
Consumers are also less optimistic about the future. |

Steve is the Economist for Washington Trust Bank and holds a Chartered Financial Analyst® designation with over 40 years of economic and financial markets experience.
Throughout the Pacific Northwest, Steve is a well-known speaker on the economic conditions and the world financial markets. He also actively participates on committees within the bank to help design strategies and policies related to bank-owned investments.