


Economic Summary
The takeaways from this week's economic data:
-
The economy shrank 0.3% in the 1st quarter due to a surge in businesses front loading their import purchases before the April tariff announcement. Imports subtracted over 4 percentage points from GDP as imports grew by over 40% on an annualized basis.
-
The jobs market remains stable as the nation added 177,000 jobs in April and initial jobless claims remain range-bound between 200,000 to 250,000. For those who do become unemployed it is harder to find a job as continuing jobless claims continue to rise and the average duration of unemployment rose from 22.8 weeks in March to 23.8 weeks in April.
-
The “vibecession” (i.e., sentiment levels historically associated with recessions) is back as consumer and business sentiment polls are at or near record lows. Despite the depressed sentiment, spending continues as inflation adjusted personal spending rose 3.3% year-over-year in March.
-
No major news on tariffs, although the Administration has stated that negotiations are underway, and deals will be announced over the coming weeks.
Perspectives
Over the past two weeks we have learned about the state of the US manufacturing industry. First, from the perspective of the industries within manufacturing and then the jobs within the manufacturing industries. What we learned was that manufacturing output is alive and well, but job losses have occurred. This week concludes the analysis of the manufacturing industry by examining the growth/(decline) in manufacturing jobs by state.
Commentary
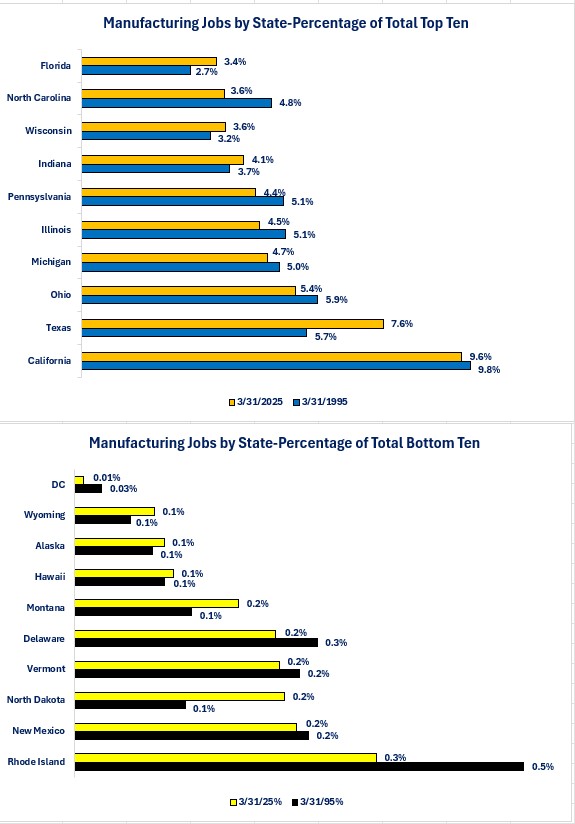
Let us start by examining the top and bottom ten states as measured by their manufacturing jobs as a percentage of total manufacturing jobs in the US. If we compare the percentages for top ten states between 1995 and 2025, what you can see from the graph below is that four of the states (Texas, Indiana, Wisconsin, and Florida) experienced increases in percentage while the remaining six experienced decreases. Examining the bottom ten states shows a 50/50 split between states that gained in their percentage of the total and states that shrank in percentage. Overall, 22 states experienced an increase in their percentage of total manufacturing jobs while the rest experienced decreases. What that is telling us is that manufacturing jobs are shifting between states as new manufacturing facilities are not necessarily being built in the same states that may have experienced closures of old facilities. That creates a problem for an employee of a manufacturing facility that reduces staff or closes if they do not have the ability to move to the states that are experiencing growth.
-
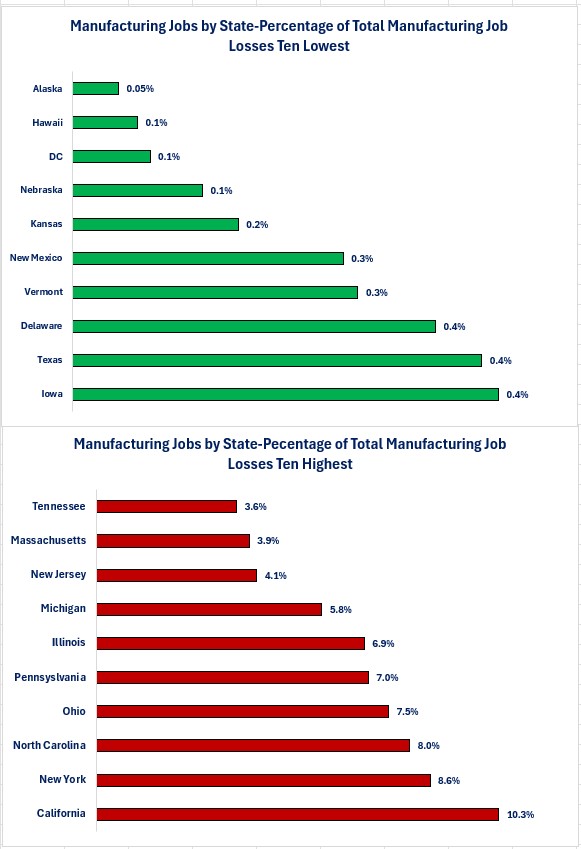
Texas was the big winner as its percentage of total manufacturing job losses tied with Delawar and Iowa for the lowest percentage at 0.4%. That is impressive since Texas is #2 for percentage of total manufacturing jobs.
-
Four states (Massachusetts, New Jersey, New York, and Tennessee) were not in the top ten for percentage of total manufacturing jobs but were members of the ten states with the highest percentage of total job losses.
-
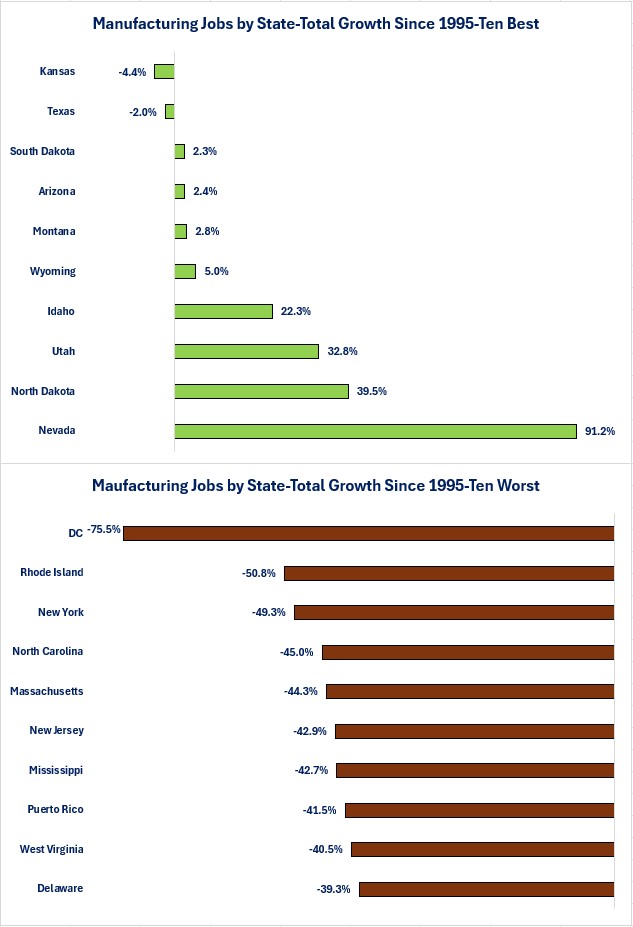
Eight states had job gains (Arizona, Idaho, Montana, Nevada, North Dakota, South Dakota, Utah, and Wyoming). Because all are smaller states, the number of job gains was 99,300 total job gains compared to 4,766,700 job losses for the rest of the states.
The final way to examine manufacturing jobs at the state level is to examine the growth rate over the 30 years. Since all but eight states suffered job losses, most of the growth rates are negative. This will show us what percentage of the manufacturing jobs that existed in 1995 were lost. Examining the graph below, we can see that Nevada has experienced the highest growth rate as its manufacturing jobs are currently 91.2% higher than they were in 1995. The flip side is that the District of Columbia (DC) has lost 75.5% of its manufacturing jobs. As always, I will caution that size affects growth rates. Yes, DC lost 75.5% of its manufacturing jobs but DC only had 4,900 manufacturing jobs in 1995 and that fell to 1,200 jobs. Compare that to California, which lost 482,700 manufacturing jobs but that is a 24.8% loss of jobs. Overall, 39 states lost over 10% of the manufacturing jobs that existed in 1995. Of those 39 states, 29 of them lost over 20% and 22 of the 39 states lost over 30% of the jobs that existed in 1995.
Conclusions
The state level manufacturing jobs data shows that the job losses that have occurred over the past 30 years were widespread since only eight states experienced jobs growth while the rest experienced job losses. Like the industrial revolution that displaced farmers but created new jobs on assembly lines, the evolution of the US economy from a goods producing economy to a service sector economy has displaced manufacturing workers but created service sector jobs.
What does not get a lot of press is the quiet rise of new manufacturing industries that look nothing like the old manufacturing industries and facilities. The opportunity, but also challenge, is for states to identify how to attract these manufacturing industries to their state and how to provide the education or cross training needed to provide a labor force to fill the job openings.
Disclosures
-
Jobs data is from the Bureau of Labor Statistics.
-
Data is as of 3/31/25.

Steve is the Economist for Washington Trust Bank and holds a Chartered Financial Analyst® designation with over 40 years of economic and financial markets experience.
Throughout the Pacific Northwest, Steve is a well-known speaker on the economic conditions and the world financial markets. He also actively participates on committees within the bank to help design strategies and policies related to bank-owned investments.