


Economic Summary
It was a busy week with economic data. Overall, we learned that consumers and small businesses remain pessimistic but are still buying. The headline grabbing news was the announcement on Monday that the US and China had agreed to roll back the sky-high tariff rates for 90 days and continue negotiations. That leaves all countries with a 10% tariff tax imposed on them by the US and China with a 30% tariff tax for imports into the US. Some of the economic highlights include:
Inflation
The Consumer Price Index (CPI) fell from a year-over-year rate of 2.4% in March to a 2.3% rate in April. Falling energy prices offset increases on other items. The Core CPI remained unchanged at 2.8%.
Interest rates
Interest rates remained stable. The 30-year mortgage rate rose slightly from 6.84% to 6.86%. As a result, mortgage applications only rose slightly by 1.1%.
Jobs
Based on filings for unemployment benefits, the jobs market remains stable. Initial jobless claims were unchanged from last week and continuing claims rose 9,000.
Consumer Spending
Retail sales rose 5.2% on a year-over-year basis. This is the same pace as March. The biggest increase in spending in April was at restaurants and bars.
Sentiment
Small businesses remained pessimistic as the Small Business Optimism index fell from 97.4 to 95.8. Small business owners indicated that a lack of qualified help was their biggest challenge. Based on the results from the University of Michigan Consumer Sentiment index, consumers continued to be pessimistic too. The consumer sentiment index fell from 52.2 to 50.8. Their outlook for both their current and future situation fell. What may be concerning for the Federal Reserve is that they expect higher inflation both for the next year and for the longer term.
Perspectives
Today's Perspectives section examines what has been happening with small businesses, based on the results of the most recent Business Trends and Outlook Survey (BTOS) conducted by the Census Bureau. The last time we checked in on small businesses was based on data as of 2/7/25. The most recent data is now 5/2/25. This should give us insight into how things have changed over the past three months, but it also gives us almost a full month's worth of tariffs being in place. Today we will focus on how sales/receipts/revenues have been affected as well as prices paid, and prices charged. I will continue to break down the responses using the breakdowns that the Census Bureau uses for small business size-based on number of employees.
Let us start by seeing how things have changed with sales/receipts/revenues (SRR). Like to the 2/7/25 data, the current data shows that the majority of small business owners responded that their SRR were unchanged. Within the No Change category, the percentage fell compared to 2/7/25. The next highest response rate was for those responding that their SRR decreased. Between 22% and 32% of the responses fell into this category. The category of most interest is the percentage who responded that their SRR increased. Those businesses with 50-99 employees saw the biggest percentage point increase as their percentage was 17.40% as of 2/7/25 and rose and 22.7% as of 5/2/25. The increase in small business' SRR may reflect consumers pulling future purchases forward to avoid potential price increases due to tariffs. Stockpiling would increase SRR. If this stockpiling was completed in advance of the 4/2/25 tariff announcement, then we should see some or all of the SRR increase unwind as consumers using their stockpile do not buy more in the short-term.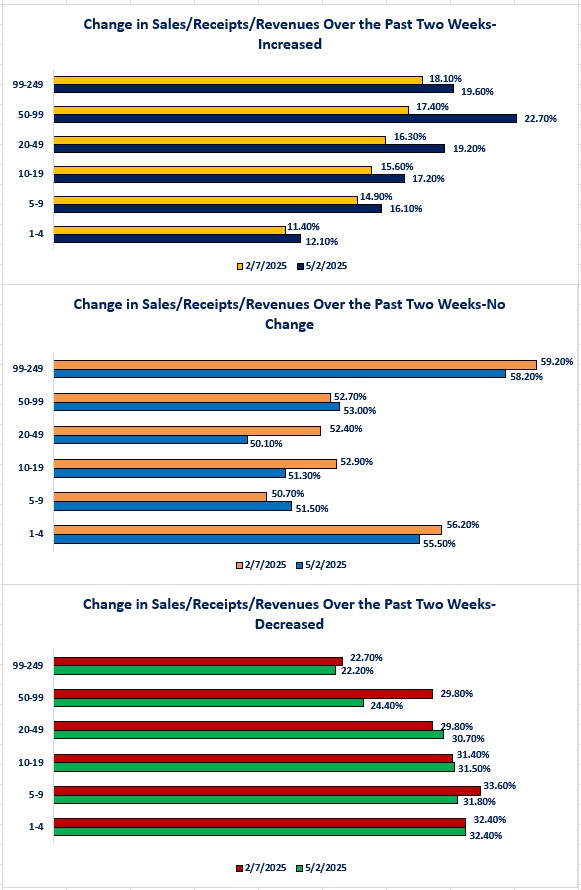
Now, let us examine what happened with prices paid by businesses. In theory, since the new tariffs went into effect in April, we should see the Increased category percentage grow unless small businesses also stockpiled their inventories. The problem is that most small businesses do not have the cash on hand and may not have the ability to borrow to let them stockpile. In reality, many small businesses saw the price rise for what they need to purchase. As of 2/7/25 between 25.20% to 37.10% of business owners reported prices increases on the products that they had to buy. As of 5/2/25, that range of percentages grew to 32.70% to 45.60%. The No Change category still remains the biggest percentage of responses, but it shrank from over 60% for all small business sizes to now having only two small business sizes remaining over 60%. Few small businesses experienced price decreases as the highest percentage was for small businesses with 1-4 employees and that percentage was less than 2.4% of the total. 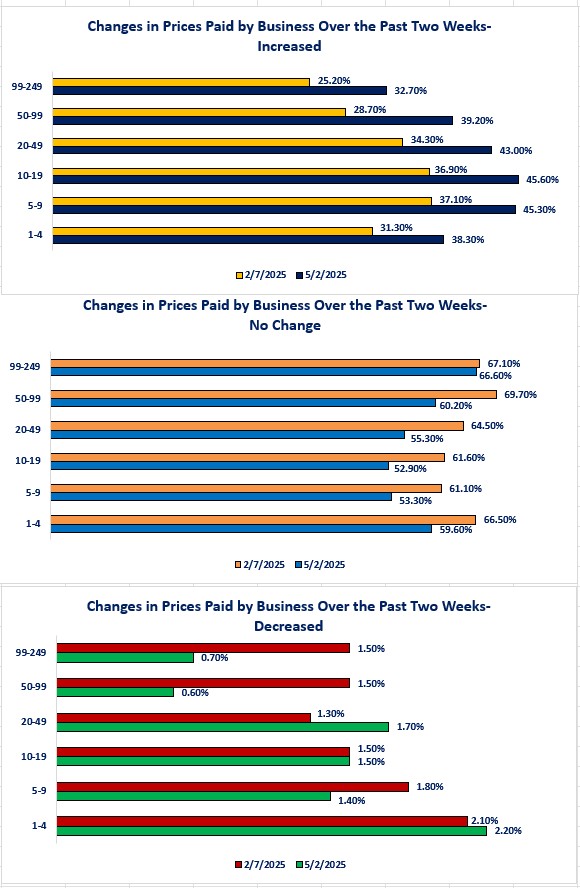
Finally, let us examine what small business owners did with the prices they charge their end user. What the graphs show us is that more small businesses passed on price increases compared to 2/7/25. As of 2/7/25 the percentage of small businesses raising prices was between 11.20% and 15.30%. Now that range has increased to between 11.40 and 19.50%. Even though more passed through price increases, the percentages are less than the percentage of small businesses who suffered price increases for the items they had to buy. As discussed above the range for small businesses that are paying higher prices was 32.7% and 45.6%. That means that profit margins fell. Remember that SSR can rise if consumers buy more, but the profit margin can fall if expenses (i.e., price paid) rise more than income (i.e., prices charged). In plain English, small businesses were generating more SSR but suffering a lower profit margin for each item sold. As the percentage of small businesses raising prices rose, the percentage leaving prices unchanged fell. Interestingly, the percentage of small businesses that lowered prices was higher than the percentage that paid lower prices. This may be a sign that some small businesses were forced to lower prices to remain competitive with their large company competitors. That is not a winning formula for a small business since that strategy also reduces the profit margin.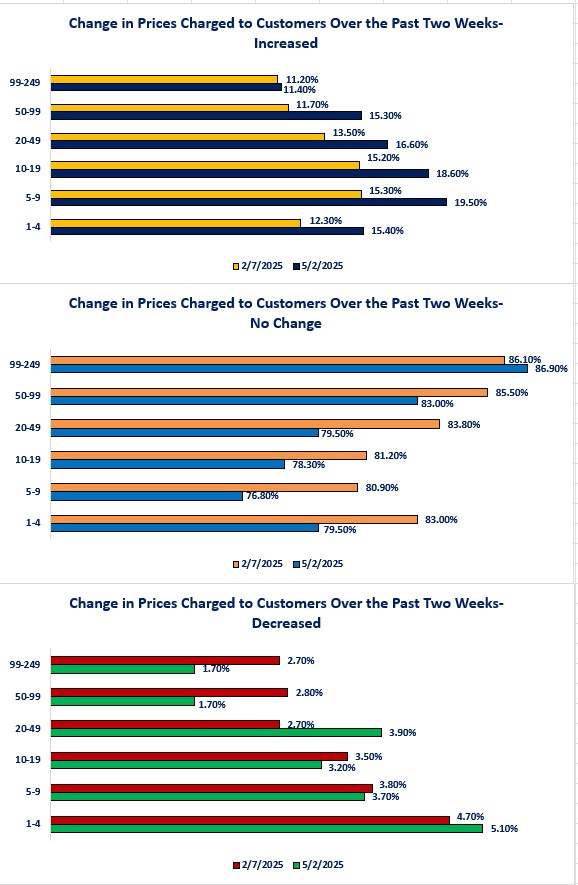
The takeaways from the BTOS price data are:
-
The majority of small business owners have not experienced higher prices for the products they have to buy and are not raising prices on the products they sell. Over the past three months that percentage has decreased.
-
A higher percentage of small business owners are paying higher prices for the products they buy. That percentage has grown over the past three months and is now between 32% and 45% depending on business size.
-
The percentage of business owners raising prices for the products they sell grew over the last three months, but it is still a smaller percentage than those who had to pay higher prices for the products they buy.
From a macro viewpoint, small businesses do not have the same financial resources as big business and mega corporations to weather a long lasting “tariff storm.” Small businesses also do not have the equivalent of the Paycheck Protection Program that helped many weather the “pandemic storm.” My concern is that the nation risks losing well run small businesses who were not able to survive the impact from the tariff tax. As I have said in the past, ”main street" small businesses are the life blood of most cities and towns in the US. Every city and town have small businesses as part of its community, few have large businesses or mega corporations. We are in the initial stages of the new tariff tax policy so, it is too early to tell what the damage may be to small businesses. We also do not know whether any type of relief programs will be established or whether the proposed tax bill and de-regulation actions will help offset the tariff tax impact. If American citizens are truly going to embrace a “buy American” strategy, then the first step would be to support your local small businesses during these times of volatility and uncertainty.
Next week's Perspectives section will examine any changes that have occurred for small businesses as it relates to paid employees and hours worked.
Disclosures
Data Source:
Census Bureau Business Trends and Outlook Survey

Steve is the Economist for Washington Trust Bank and holds a Chartered Financial Analyst® designation with over 40 years of economic and financial markets experience.
Throughout the Pacific Northwest, Steve is a well-known speaker on the economic conditions and the world financial markets. He also actively participates on committees within the bank to help design strategies and policies related to bank-owned investments.