


Perspectives
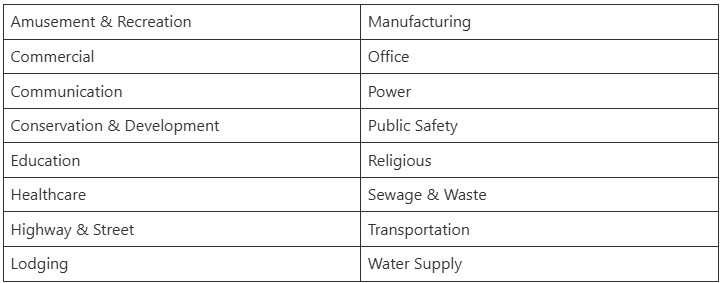
In this week’s Perspectives, we examined the 16 major subcomponents of non-residential construction spending. For the sake of simplicity, we focused on the top and bottom five subcomponents in terms of spending. The goal was to identify trends in spending over time and explore the possible forces contributing to spending in one direction or the other.
Soundbite
Within the top five major subcomponents, we observed that construction spending on manufacturing is the overwhelming standout. Construction spending on power is significant, yet volatile, while construction spending on education has fallen off substantially. Within the bottom five major subcomponents, we observed relatively flat construction spending across the 20-year period. Of mention is that construction spending on lodging and religious projects trended downward while construction spending on water supply has rebounded following the brief COVID-19 recession.
Over time, it appears that significant changes in spending are highly correlated with targeted federal spending as well as changing cultural trends, technology, and disruption.
Observations
Over this 20-year period, we discovered that the top and bottom five subcomponents were as follows: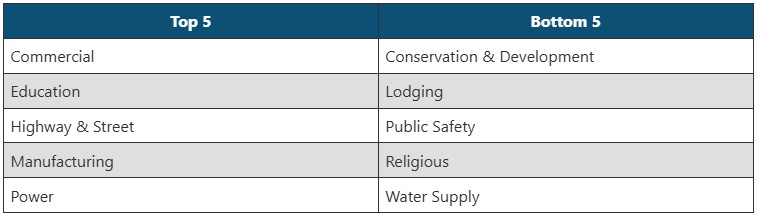
Upon review of the top five sectors, we can see an obvious and interesting trend quickly emerges. Construction spending on manufacturing has risen significantly following both the Great Recession and the COVID-19 recessions.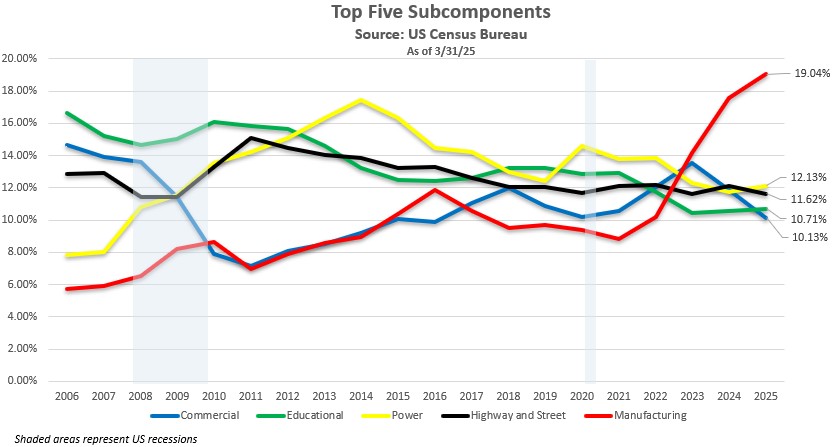
One thing we learned from a previous Economic Perspectives (dated 4/18/25) is that US manufacturing is very much alive and well. Spending on manufacturing is clearly a standout, climbing from 6% in 2005 to over 19% in 2025. What are the possible drivers for this outsized growth?
With the understanding that causation is complex, here are our thoughts. Reshoring manufacturing became a priority as mounting tensions between the US and China, the COVID-19 pandemic, and the war in Ukraine created global supply chain disruptions which exposed just how sensitive the US is to offshore manufacturing. Massive federal fiscal incentives following the COVID-19 recession also likely contributed to the significant uptick from 2021-2025. Specifically, they are:
- Infrastructure Investment and Jobs Act (IIJA, 2021) which targeted projects in transportation, broadband, water, and energy.
- Stimulated demand for construction materials and equipment. It also provided funding for grid modernization and EV infrastructure.
- Inflation Reduction Act (IRA, 2022) which targeted clean energy climate resilience, and US industry.
- This provided billions in tax credits and funding for the purpose of manufacturing solar panels, wind turbines, batteries, electric vehicles, etc.
- CHIPS and Science Act (2022) which focused on semiconductor and manufacturing R&D
- $52.7 billion was allocated to boost domestic semiconductor production.
Opposite the strength found in spending on manufacturing, we can see that construction spending on education moved in an unfavorable direction over this period. In 2005 it was the most significant subcomponent and has since, trended lower - declining from 17% in 2005 to just under 11% in 2025. As we consider this subcomponent and attempt to determine a rationale for why, a few macro themes come to mind: declining birthrates, competing infrastructure needs, and state and local budget pressures.
-
Declining Birthrates - The US has seen a significant decline in births since the early 2000s.In fact, from 2005-2023, the crude birthrate (number of live births, per 1,000 per year) has declined from 14 to only 10.7.This has likely led to fewer students which means weaker enrollment, and likely less demand for new school buildings.
-
Competing Infrastructure Needs – as previously noted about manufacturing, federal spending over the prior decade had primarily targeted clean energy, transportation, and semiconductors.
- State and Local Budget Pressures – Public schools are primarily funded by state and local governments. Many took significant funding hits following the Great Recession.
Construction spending on power continues to be significant, but also volatile. Notably, spending on power-related construction rose significantly following the Great Recession topping out at nearly 17.5% in 2014 over this period. If we think back to the period of 2009-2014, there was a lot happening that likely contributed to outsized spending on power-related projects. There was the American Recovery and Reinvestment Act (ARRA) of 2009 which directed billions towards energy infrastructure and heavily incentivized renewables and grid modernization, inclusive of replacing and upgrading aging infrastructure like transmission lines, substations, and power plants.
Of equal interest is the notable decline in construction spending on power from 2015-2025.This is interesting because new developments in technology (e.g. blockchain, data centers, and artificial intelligence) began to consume significantly more power. Early growth in Bitcoin mining began in earnest between 2009-2016 and spiked considerably in 2017 according to the Cambridge Bitcoin Electricity Consumption Index (CBECI). From a power consumption standpoint, development in artificial intelligence really began to ramp up as early as 2017, and by 2024, utilities and governments began to take notice of AI data centers as major power consumers.
So why did construction spending on power begin to taper off? By 2019, many of the large-scale projects supported by the ARRA had been completed or were in the process of winding down, which would naturally result in a decline in spending. It’s also possible that policy uncertainty and regulatory constraints slowed spending. The presidential transition from Donald Trump to Joe Biden (2020-2021) introduced uncertainty around energy policy (fossil fuels to renewables), permitting, and tax credits.
Upon review of the bottom five subcomponents, we can see that with a few exceptions, construction spending has been consistent or flat over the 20-year period.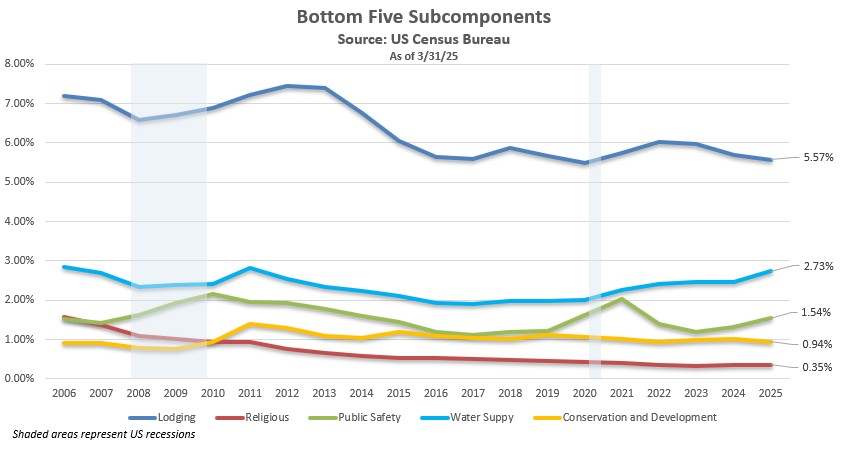
The first exception is construction spending on lodging. Lodging benefited from a post Great Recession boom likely as a result of low interest rates. Construction spending then rapidly declined from 2013-2019. The decline in spending appears to correlate closely with the introduction of short-term rentals like Airbnb and Vrbo (disruptors).
Also of mention is construction spending on religious projects, as it has declined steadily over the 20-year period. In an attempt to answer why, it would appear that fewer Americans are going to church. A fairly recent Pew Research study (2023-2024) found that Americans who define themselves as Christian, declined from 78% in 2007 to 63% in 2024.Aging populations and shrinking congregations also likely result in reduced giving which makes it increasingly difficult to justify the construction of new or additional buildings.
A final standout is construction spending on water supply as spending rebounded following the COVID-19 pandemic recession. Again, a major catalyst here appears to be targeted federal spending. The IIJA (mentioned earlier) directed over $50 billion towards various projects to address concerns ranging from climate change to aging infrastructure.
Some of the spending targeted the safety of drinking water by addressing Per- and Polyfluoroalkyl Substances (PFAS or “forever chemicals”) as well as lead pipe replacement. Several states also invested heavily in reservoirs and water storage projects, desalination plants as well as stormwater capture and aquifer recharge technologies. Finally, and in an effort to tie water supply back to developments in technology, it’s worth acknowledging that AI data centers are not just power hungry, they also demand water for cooling purposes. It’s likely that as these industries grow, so will demand for water supply.
Closing Thoughts
Economic Summary
Consumer Confidence:
Confidence surprised to the upside as US consumers breathed a sigh of relief following the 90-day trade truce with China. The Conference Board Consumer Confidence index rose to 98 from 85.7 and beyond expectations of rising to only 87.
Sentiment also improved as the University of Michigan consumer sentiment survey was revised sharply higher from 50.8 to 52.2 in May. At the same time, the index for consumer expectations rose, while the gauge for current conditions worsened. Finally, one-year inflation expectations were little changed at 6.6%.
Durable Goods:
Durable goods (everything from toasters to aircraft) declined less than anticipated but still points towards weaker demand for equipment as policy uncertainty looms.
Gross Domestic Product (GDP):
The economy has still shown to have contracted in the first quarter, just slightly less than originally thought. The second estimate for Q1 improved to -0.2% from -0.3%. The modest improvement was driven primarily by an increase in fixed investment, which partially offset weakness in consumer spending and the larger than expected drag from trade.
Personal Income & Spending:
Personal income rose by 0.8% on the month in April. This follows an upwardly revised 0.7% increase in March and exceeded expectations of an increase of only 0.3%. Contributing significantly to the surge in income was a onetime boost in Social Security payments as a result of the Social Security Fairness Act. At the same time, personal consumption expenditures (PCE or personal spending), rose by 0.2% on the month, slowing from a 0.7% increase in March, and was in-line with expectations.
Inflation:
Core Personal Consumption Expenditures (CORE PCE) is the Federal Reserve’s (Fed) preferred measure of inflation. On the month in April, prices rose 0.1%, unchanged from March and in-line with expectations. On the year, prices rose only 2.5%. That was down from 2.7% in March and a step closer to the Fed’s target of 2%.
Disclosures
-
The Economic Perspectives newsletter is comprised entirely of the expertise, thoughts, perspectives and opinions of the author with no use of generative AI. Data is sourced from the original providers (typically government agencies) and analyzed by the author.
-
The US Census Bureau reports data on residential and non-residential construction spending.
- The most recent data is as of 3/31/25.
- The period being examined is the last 20 years (i.e., 4/1/05 – 3/1/25).
- Data sets being examined are:
- Each of the 16 major subcomponents for non-residential construction spending were adjusted for inflation utilizing the Producer Price Index for Construction Materials sourced from the US Bureau of Labor Statistics as of 3/31/25.

Senior Portfolio Manager