


Economic Summary
This week's economic data was mixed but, overall, showed an economy that is still growing but at a slower pace.
Interest Rates
The Federal Reserve completed its monetary policy meeting and announced that it was leaving its short-term interest rate unchanged. The Federal Reserve communicated that the economic data still showed a healthy economy and, as a result, it will continue to monitor the economic data to determine if any changes are needed in the future. The Federal Reserve's “Dot Plot” (a survey of the Board Members, not an official forecast) showed that most Board members believe a reduction of 0.5% would probably occur before the end of the year.
Jobless Claims
The number of people filing for initial unemployment benefits last week fell by 5,000 compared to the previous week. Total initial claims were 245,000 and remained in the 200,000 to 250,000 range. Continuing claims fell 6,000 last week compared to the week before.
Manufacturing Activity
Manufacturing data showed different results depending on the region of the US. The national Manufacturing Index rose from -0.5% in April to +0.1% in May. Manufacturing activity in the New York Federal Reserve district fell from -9.2 to -16.0 while activity in the Philadelphia district was unchanged from last month. The index remains negative at -4.0.
Mortgage Data
After strong activity during the previous week, mortgage activity fell back last week. Mortgage applications fell 2.6% after rising 12.5% the previous week. The decline was led by a 2.9% decline in purchase activity while refinancing activity fell 2.1%. The 30-year mortgage rate fell from 6.93% to 6.84%.
Retail Sales
Headline Retail Sales fell 0.9% in May. That was primarily due to a 3.5% decrease in motor vehicle sales. This was an unwinding of the strong results in March when consumers appeared to be rushing to buy cars before the tariffs went into effect. Core Retail Sales only fell 0.3% and year-over-year Retail Sales were up 3.3%. This is slower than the 5.1% pace in April but still shows consumers are buying discretionary items.
Perspectives
A previous Economic Perspectives newsletter examined housing affordability in the US. This week's Perspectives section examines overall affordability at the state level. SmartAsset released data on a study it conducted to determine the salary needed to live a “comfortable lifestyle.” By that they mean that a person can live by the 50/30/20 rule. This rule says that you should budget 50% of your pre-tax wage for your core expenses (food, childcare, medical, housing, transportation, civic, internet and mobile, other), 30% for discretionary purchases and 20% for long-term goals (i.e., non-housing debt repayment, education, or retirement).
Let us start by ranking the states from the most affordable (lowest wage requirement) to least affordable (highest requirement) and then begin by examining the top third of states that are most affordable. The graph below shows that West Virginia has the lowest wage requirement to live a comfortable lifestyle. Even with the most affordable rank, a worker would have to earn over $80,000 per year to live a comfortable lifestyle. What we also see is that the majority of the most affordable states (nine out of seventeen) are in the South region (Southwest and Southeast).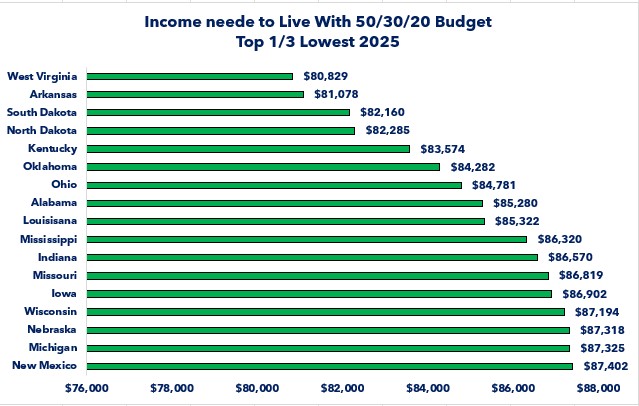
If we look at the states that are in the top third for the highest wages needed to live a comfortable lifestyle, we discover that over 75% of the highest salary requirement states are coastal states (East and West coast). Essentially you need $100,000 (rounding) or more to live a comfortable lifestyle in the coastal states. Two out of the three states where Washington Trust Bank has offices are in the top third for least affordable.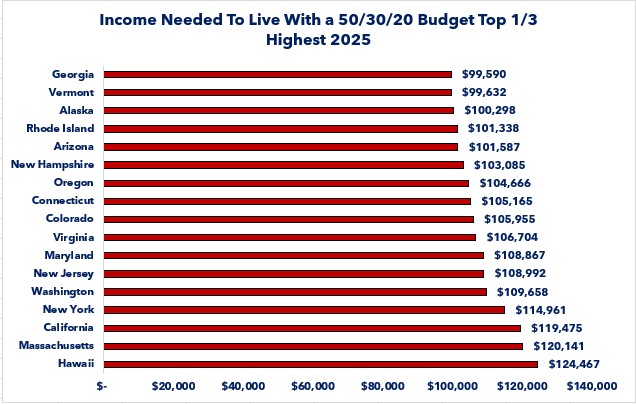
The above graphs tell us the projected` salary needed to live comfortably for each state. The question then becomes “what is the actual annual wage for each state?” The cold reality is that, based on the average annual salary provided by the Bureau of Labor Statistics, there is no state where the average worker earns enough to cover core expenses, discretionary expenses and long-term goals based on the calculation of those categories from the MIT model as shown in the table below.
The table below ranks the states based on their average wage. When examining the MIT data what can be observed is that the average worker earns enough to cover their core expenses. When you add discretionary expenses, the average wage only covers 49% of the discretionary expenses. This may help explain why consumer debt has risen as much as it has. If someone cannot pay for all of their expenses, and is unwilling to cut back on discretionary expenses, they may charge it on their credit card and make the minimum monthly payment. That may also help explain surveys that regularly show the average worker says they cannot afford an unplanned expense of $500 or more.
|
State |
Core Expenses |
Discretionary Expenses |
Long-term Expenses |
Average Wage |
Surplus/ |
|
West Virginia |
$40,414.5 |
$25,284.6 |
$16,856.4 |
$52,440 |
$ (30,115.50) |
|
Mississippi |
$43,160.0 |
$32,897.4 |
$21,931.6 |
$52,538 |
$ (45,451.00) |
|
New Mexico |
$43,701.0 |
$24,248.7 |
$16,165.8 |
$53,067 |
$ (31,048.50) |
|
Arkansas |
$40,539.0 |
$34,488.3 |
$22,992.2 |
$53,572 |
$ (44,447.50) |
|
Louisiana |
$42,661.0 |
$28,591.8 |
$19,061.2 |
$54,547 |
$ (35,767.00) |
|
Delaware |
$48,734.5 |
$26,158.2 |
$17,438.8 |
$54,706 |
$ (37,625.50) |
|
Oklahoma |
$42,141.0 |
$25,434.3 |
$16,956.2 |
$54,773 |
$ (29,758.50) |
|
Kentucky |
$41,787.0 |
$32,660.1 |
$21,773.4 |
$56,282 |
$ (39,938.50) |
|
South Carolina |
$46,072.0 |
$32,011.2 |
$21,340.8 |
$56,522 |
$ (42,902.00) |
|
Alabama |
$42,640.0 |
$36,042.3 |
$24,028.2 |
$57,050 |
$ (45,660.50) |
|
South Dakota |
$41,080.0 |
$29,403.0 |
$19,602.0 |
$57,217 |
$ (32,868.00) |
|
Indiana |
$43,285.0 |
$25,072.2 |
$16,714.8 |
$58,620 |
$ (26,452.00) |
|
Maine |
$48,297.5 |
$29,839.8 |
$19,893.2 |
$58,937 |
$ (39,093.50) |
|
Missouri |
$43,409.5 |
$26,070.6 |
$17,380.4 |
$59,127 |
$ (27,733.50) |
|
Tennessee |
$45,739.0 |
$26,195.4 |
$17,463.6 |
$59,213 |
$ (30,185.00) |
|
Kansas |
$43,805.0 |
$28,928.7 |
$19,285.8 |
$59,962 |
$ (32,057.50) |
|
Montana |
$46,425.5 |
$27,855.3 |
$18,570.2 |
$60,057 |
$ (32,794.00) |
|
North Carolina |
$46,883.0 |
$29,765.4 |
$19,843.6 |
$60,328 |
$ (36,164.00) |
|
Georgia |
$49,795.0 |
$29,889.6 |
$19,926.4 |
$60,377 |
$ (39,234.00) |
|
Ohio |
$42,390.5 |
$30,476.1 |
$20,317.4 |
$60,405 |
$ (32,779.00) |
|
Illinois |
$49,005.0 |
$27,443.4 |
$18,295.6 |
$60,427 |
$ (34,317.00) |
|
Florida |
$48,693.0 |
$30,401.4 |
$20,267.6 |
$60,452 |
$ (38,910.00) |
|
Nebraska |
$43,659.0 |
$29,877.0 |
$19,918.0 |
$60,460 |
$ (32,994.00) |
|
Iowa |
$43,451.0 |
$29,240.7 |
$19,493.8 |
$60,549 |
$ (31,636.50) |
|
Idaho |
$48,214.5 |
$28,129.8 |
$18,753.2 |
$61,083 |
$ (34,014.50) |
|
Nevada |
$49,609.0 |
$27,643.2 |
$18,428.8 |
$61,114 |
$ (34,567.00) |
|
Wyoming |
$43,971.0 |
$31,549.5 |
$21,033.0 |
$61,425 |
$ (35,128.50) |
|
Wisconsin |
$43,597.0 |
$35,842.5 |
$23,895.0 |
$61,467 |
$ (41,867.50) |
|
Vermont |
$49,816.0 |
$31,399.8 |
$20,933.2 |
$61,752 |
$ (40,397.00) |
|
Arizona |
$50,793.5 |
$24,648.0 |
$16,432.0 |
$62,236 |
$ (29,637.50) |
|
Michigan |
$43,662.5 |
$30,089.4 |
$20,059.6 |
$62,287 |
$ (31,524.50) |
|
Utah |
$49,733.0 |
$32,697.6 |
$21,798.4 |
$62,917 |
$ (41,312.00) |
|
North Dakota |
$41,142.5 |
$25,584.0 |
$17,056.0 |
$62,967 |
$ (20,815.50) |
|
Texas |
$45,385.5 |
$31,786.5 |
$21,191.0 |
$63,185 |
$ (35,178.00) |
|
Pennsylvania |
$47,653.0 |
$26,283.0 |
$17,522.0 |
$63,200 |
$ (28,258.00) |
|
Minnesota |
$45,639.0 |
$24,323.4 |
$16,215.6 |
$63,517 |
$ (22,661.00) |
|
Hawaii |
$62,233.5 |
$26,382.6 |
$17,588.4 |
$64,044 |
$ (42,160.50) |
|
Rhode Island |
$50,669.0 |
$26,045.7 |
$17,363.8 |
$64,624 |
$ (29,454.50) |
|
Alaska |
$50,149.0 |
$28,978.5 |
$19,319.0 |
$64,759 |
$ (33,687.50) |
|
Oregon |
$52,333.0 |
$26,220.6 |
$17,480.4 |
$65,514 |
$ (30,520.00) |
|
Connecticut |
$52,582.5 |
$26,197.5 |
$17,465.0 |
$66,954 |
$ (29,291.00) |
|
Colorado |
$52,977.5 |
$27,383.4 |
$18,255.6 |
$67,179 |
$ (31,437.50) |
|
Maryland |
$54,433.5 |
$24,685.5 |
$16,457.0 |
$67,227 |
$ (28,349.00) |
|
Virginia |
$53,352.0 |
$25,896.0 |
$17,264.0 |
$67,371 |
$ (29,141.00) |
|
New Hampshire |
$51,542.5 |
$25,971.0 |
$17,314.0 |
$67,386 |
$ (27,441.50) |
|
California |
$59,737.5 |
$27,231.3 |
$18,154.2 |
$70,459 |
$ (34,664.00) |
|
New Jersey |
$54,496.0 |
$37,340.1 |
$24,893.4 |
$70,797 |
$ (45,932.50) |
|
Washington |
$54,829.0 |
$29,215.8 |
$19,477.2 |
$71,700 |
$ (31,822.00) |
|
New York |
$57,480.5 |
$25,596.6 |
$17,064.4 |
$72,243 |
$ (27,898.50) |
|
Massachusetts |
$60,070.5 |
$30,925.5 |
$20,617.0 |
$73,381 |
$ (38,232.00) |
It is important to maintain perspective when considering the data. The data does not mean that no one in the US can lead a comfortable lifestyle. Remember, the wages are the average for the states. We all know that there are people earning far more than $125,000 per year and there are people earning below the poverty line wages ($15,650). We also know that not everyone is experiencing the costs calculated by MIT.
The point of this week's Perspectives was to highlight two things:
- The US has an affordability problem for many of its citizens with no easy solutions. The risk is if much of the population believes that the current system is not working for them, they may be willing to vote for candidates who promise a different system. Before dismissing that risk, understand that multiple polls of younger generation workers show that they believe Capitalism is broken.
- The data is another example of the bifurcation that exists in our economy. High wage earners are most likely living a comfortable lifestyle while low wage earners are struggling to simply live a “paycheck to paycheck” lifestyle.
Disclosures
- The wage needed to live a comfortable lifestyle is from a study done by SmartAsset.
- Expenses were calculated using the MIT Living Wage model.
Average wages were from the Bureau of Laor Statistics.

Steve is the Economist for Washington Trust Bank and holds a Chartered Financial Analyst® designation with over 40 years of economic and financial markets experience.
Throughout the Pacific Northwest, Steve is a well-known speaker on the economic conditions and the world financial markets. He also actively participates on committees within the bank to help design strategies and policies related to bank-owned investments.