


Economic Summary
It was a busy week for economic data releases. The overall results continue to paint a picture of an economy that is growing but slowing. Consumers remain under pressure as their income fell in May while inflation rose. Consumer Sentiment improved but consumers continue to worry about the impact on prices from tariffs. Manufacturing activity remained mixed while service sector activity slowed.
Consumer Sentiment and Confidence
The Conference Board reported a further drop in its Consumer Confidence Index as consumers continue to worry about higher prices related to inflation. The index fell from 98.4 to 93.0. The University of Michigan's Consumer Sentiment index rose from 52.2 to 60.7.
Economic Growth
The final revision to first quarter economic growth-as measured by Gross Domestic Product- showed that the economy shrank by 0.5% in the first quarter. Current forecasts are for the distortion from imports to unwind in the second quarter and result in positive economic growth.
Housing Data
Existing home sales rebounded from the negative growth posted in April as existing home sales rose 0.8% in May. New home sales declined13.7% in May after rising 9.6% in April. The South region experienced the biggest decline at -21.0%.
From a mortgage perspective, the Mortgage Banker Association reported a 1.1% increase in mortgage applications last week after a 2.6% decline the week before. All if the increase was due to an increase in refinancing applications. Purchase applications were unchanged while the 30-year mortgage rate rose slightly from 6.84% to 6.88%.
Income and Spending
Personal income fell 0.4% in May but still rose 4.5% on a year-over-year basis. For the average hourly worker who relies solely on their wages, they did not experience the decline as wage and salaries grew 0.4% for the month and 4.7% year-over-year. for those receiving government transfer payments, were hit hard as government transfer payments fell 2.3% for the month. On a year-over year basis transfer payments rose 7.5%. Income after taxes and inflation fell 07% and only rose 1.7% year-over-year. The decline in income triggered a decline in spending as real personal spending fell 0.3%. On a year-over-year basis, real personal spending rose 2.2%.
Inflation
The Federal Reserve's preferred inflation measure (Personal Consumption Expenditures Price Index) rose 2.3% year-over-year which was faster than the 2.2% pace in April. The Core Personal Consumption Expenditure index rose 2.7% after rising 2.6% in April.
Jobs Data
Initial claims for unemployment insurance fell 10,000 last week while continuing claims rose 37,000. This data continues to show companies slow to lay off people but, if you do get laid off it is taking longer to find another job.
Manufacturing Activity
S&P Global reported no change in the level of manufacturing activity in June compared to May. The index remains at 52.0. Anything above 50 indicates growth. Manufacturing activity in the Richmond Federal Reserve district improved but remained negative. The index rose from -9 to -7. Activity in the Kansas City Federal Reserve district improved but remained negative as the index rose from -3 to -2.
Service Sector Activity
S&P Global reported a decline in its Service Sector Activity Index but the level continues to indicate growth is occurring. The index declined from 53.7 to 53.1. Anything above 50 indicates growth.
Perspectives
The Census Bureau released its most recent update to its population data. This week's Perspectives section examines population changes by state. I will start at the state level and then drill down to the county and finally city level.
This analysis will take a different approach than most reports on population growth. The traditional method is to compare percentage growth rates. The weakness in that type of analysis is that the smaller the state/county/city the easier it is to post big percentage numbers. This analysis will examine numeric growth since the actual number of people impacts the labor force and infrastructure needs (including housing) of a state/county/city.
From a broad macro perspective, the southern region of the US (Southeast and Southwest) dominated population growth. From 2020 to 2024, the nation saw an 8.5 million increase in its population. When examined by Census Bureau regions, the South accounted for 73% of total growth. The West accounted for 16%, the Midwest was 7% and the Northeast was 4%. The graph below shows that the dominance in growth occurred in Texas (Southwest) and Florida (Southeast). Seven states experienced a decrease in population with New York leading the way with a loss of 288,000 people. Two of the three states where Washington Trust Bank has offices made the top twenty with Washington at #8 and Idaho at #13. Oregon was in the bottom twenty.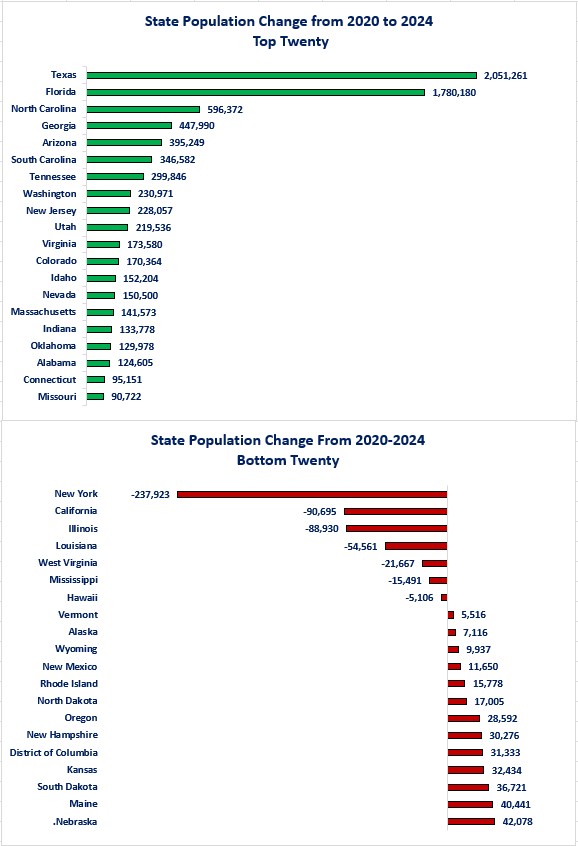
If we switch to the one-year view, the next graph shows that Texas and Florida were the leaders again. California and New York showed the biggest turnaround. These were the two states with the biggest population loss since the pandemic crisis but are now in the top five for the one-year period. There were only three states with negative population growth over the last year. Washington remained in the top twenty, but Idaho slipped out of the top twenty. Oregon remained in the bottom twenty.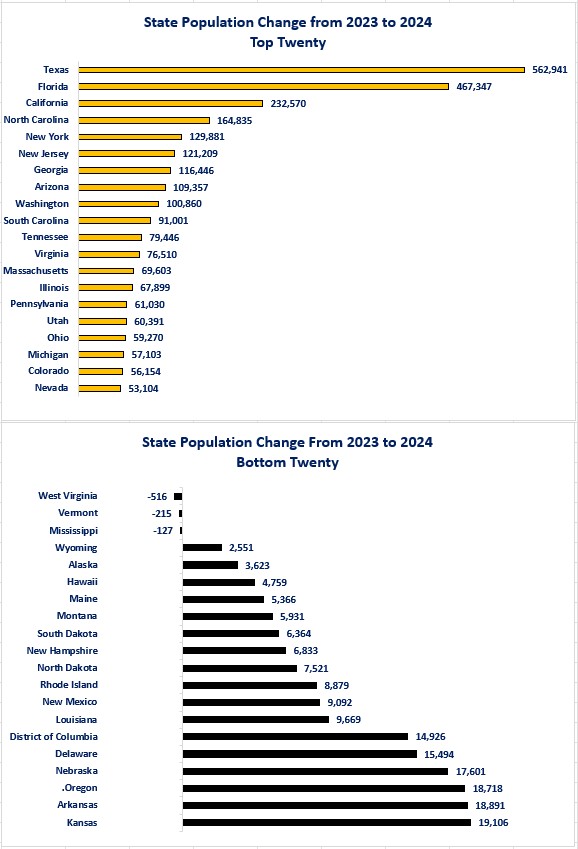
States need to understand where the population changes are occurring within the state so that they can effectively focus resources on the areas that need it. The first place to start is to understand changes at the county level. Out of the 3,143 counties included in the survey, 59% (1,854) experienced growth since the pandemic crisis; 41% (1,285) experienced negative growth Four experienced no change. The two counties with the biggest growth since the pandemic crises were Harris County, Texas (includes Houston) and Maricopa County, Arizona (includes Phoenix). Los Angeles County, California and Kings County, New York were the two counties with the biggest decline in population. Texas had 40% of the top twenty counties for growth while Florida had 30%. California had 25% of the counties in the bottom twenty and New York had 20%. Even though Idaho and Washington made the top twenty at the state level, none of their counties were in the top twenty. Oregon had Multnomah County in the bottom twenty (12). 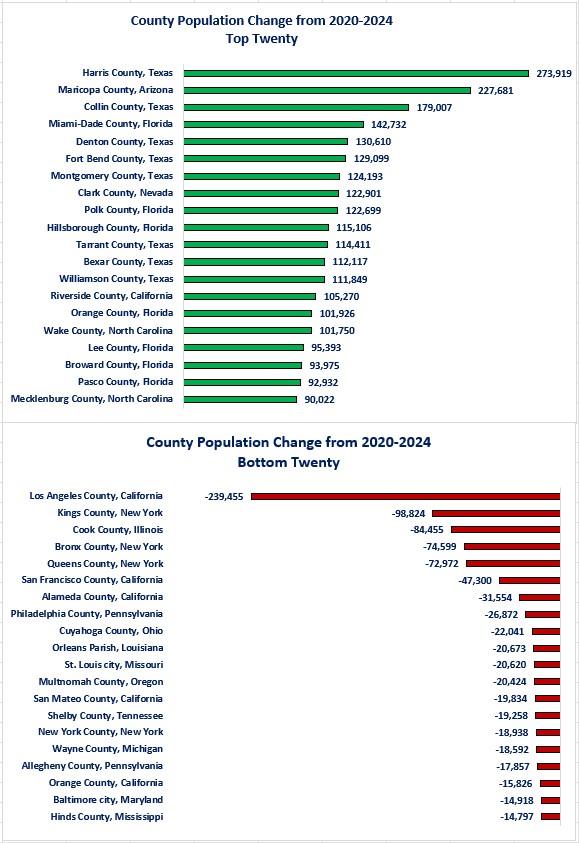
Examining the one-year results show that Texas continues to dominate the growth but not as much as the four-year results. Texas slipped from 40% since the pandemic crisis to 35% of the top twenty counties for one year, Florida fell from 30% to 15% while Arizona and California each had 10%. Even though California had 10% of the top twenty on a one-year basis, it also had 15% of the counties in the bottom twenty. Idaho, Oregon, and Washington had no counties in the top or bottom twenty.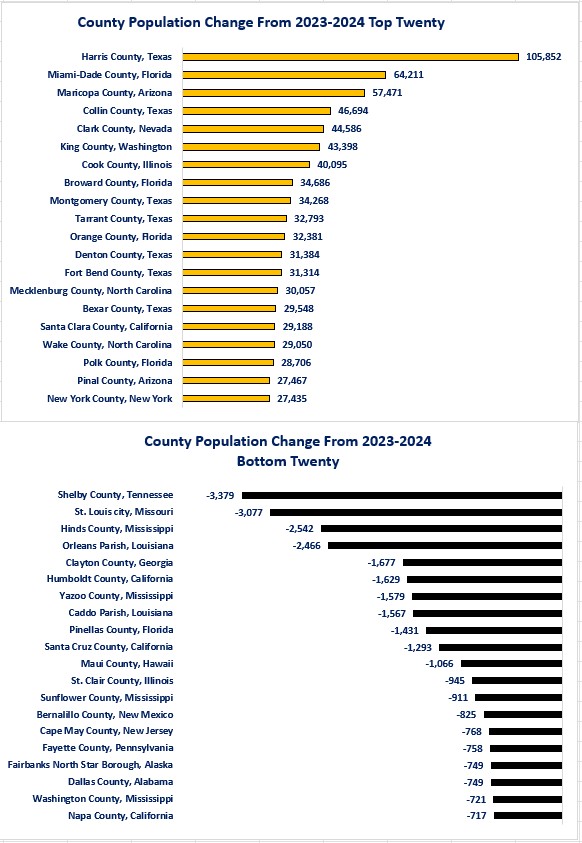
Finally, counties care about what is happening with population growth with the cities within their counties. Houston, Texas was the top city for population growth since the pandemic crisis while New York New York had the biggest population loss. California had 35% of the bottom twenty cities for population decreases. On a net basis, New York, New York accounted for all of the state of New York's population decrease. Seattle, Washington was in the top ten (9) and Portland, Oregon made the bottom twenty (12). Idaho had no cities in the top or bottom twenty.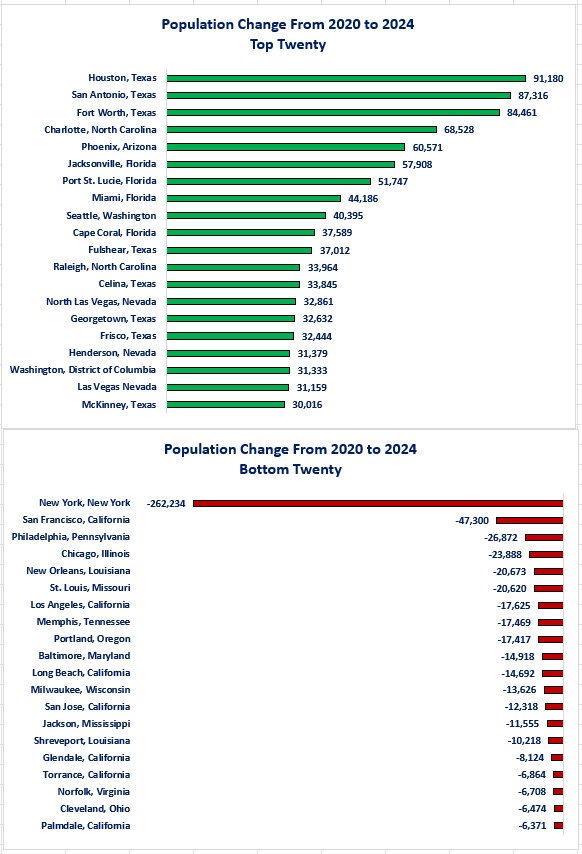
On a one-year basis, New York, New York showed the biggest turnaround. After being the worst city for population decrease since the pandemic crisis, it had the best population growth over the last year. Texas continues to lead with 25% of the top twenty and Houston at #2. Memphis, Tennessee experienced the biggest population decline over the past year, but California had 35% of the bottom twenty cities. Seattle, Washington made the top ten (9) while Idaho and Oregon had no cities in the top or bottom twenty.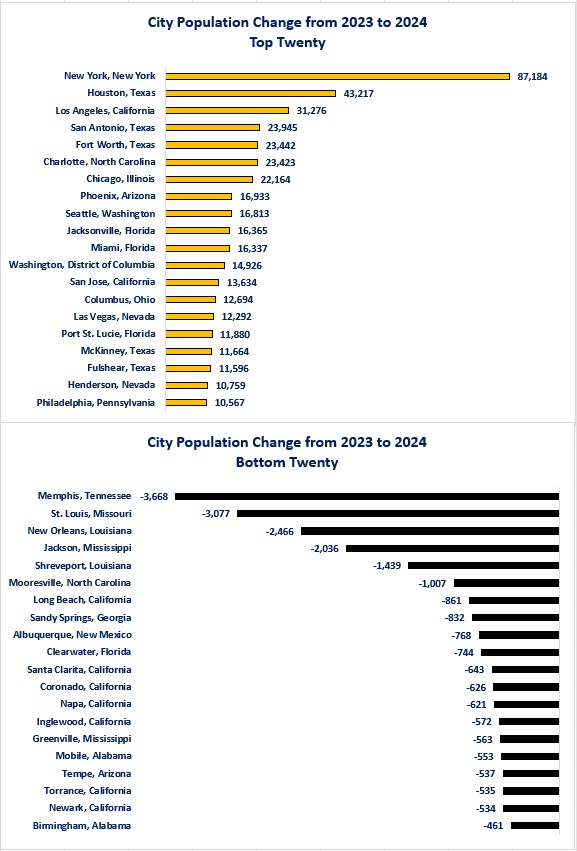
What the current update does not tell us is the make-up of the changes in population. Was it from net natural births (i.e., births minus deaths) or was it from immigration? It also does not give us current information on the demographics of the change. Was it newborns, working age, or the elderly? The Census Bureau will not release updated data that identifies that information until December.
Why should we care about population changes for states, counties, and cities? Municipalities care about population changes because it affects demand for the services they offer, infrastructure they provide, tax revenue, and ultimately their budgets. Businesses care about it from a labor force perspective, demand for their products or services as well as potential tax impacts. Individuals care about it because it affects affordability, availability of services, quality of life and taxes. There are historical examples of states, counties, and cities that experienced rapid population growth and were unable to keep up with the change. In many cases this caused skyrocketing home prices and rents as well as stressed infrastructure (i.e., streets, schools, hospitals, social services, etc.). Other states, counties, and cities were unprepared for loss of population which resulted in loss of tax revenue and budget deficits. This led to reductions in services offered and lack of maintenance of the existing infrastructure. Ultimately, those states, counties, and cities that effectively forecast, plan for, and manage changes in population will experience the best success for economic growth.
Disclosures
- Annual Estimates of Resident Population for the Unties States, Regions, States, District of Columbia, and Puerto Rico April 1, 2020, to July 1, 2024.

Steve is the Economist for Washington Trust Bank and holds a Chartered Financial Analyst® designation with over 40 years of economic and financial markets experience.
Throughout the Pacific Northwest, Steve is a well-known speaker on the economic conditions and the world financial markets. He also actively participates on committees within the bank to help design strategies and policies related to bank-owned investments.