


Economic Summary
It was a quiet week for economic data releases with little new insight on the path of economic growth. What we learned this week is that small business optimism remained essentially unchanged from the previous month as the index fell from 98.8 to 98.6. Small business owners continued to report taxes as their biggest issue.
This survey was completed before the One Big Beautiful Bill Act was passed and signed by President Trump. That bill contains tax provisions that should benefit small businesses so it will be interesting to see if optimism increases next month.
Consumers slowed their pace of borrowing as total consumer credit grew by $5.1 billion in May compared to $16.9 billion in April. Revolving credit balances (credit cards and home equity lines of credit) fell by $3.5 billion while non-revolving (auto loans, student loans and other non-revolving) balances rose by $8.6 billion.
The Labor Department's weekly report on jobless claims continues to paint a picture that companies are slow to lay people off but, if you do become unemployed, it is taking longer to find a new job as initial claims continue to decline while continuing claims continue to rise. Initial claims were 227,000 last week. This compares to 232,000 the week before and remains within the 200,000 to 250,000 range. Continuing claims rose 10,000 to 1,965,000.
Finally, the Mortgage Bankers Association reported a 9.4% increase in mortgage applications last week compared to a 2.7% increase the week before. Applications to buy a house rose 9.4% while applications to refinance a house rose 9.2%. The 30-year mortgage rate was virtually unchanged at 6.77% last week versus 6.79% the week before.
Perspectives
This week's Perspectives is revisiting the Census Bureau's Business Trends and Outlook Survey as we now have data through the
end of the 2nd quarter. The 2nd quarter was a time of uncertainty for businesses as tariff taxes were implemented but remained uncertain as to the final level and deportation added to uncertainty as it remains unclear what the final goal is for deportations.
How did small businesses fare in this uncertain environment? Today's Perspectives tries to answer that question by examining the survey results for small businesses (249 employees or less). The focus remains on small businesses since they are the lifeblood for most cities and towns in the US. The data being examined is the data closest to the end of the 1st quarter (3/23/25) versus data closest to the end of the 2nd quarter (6/29/25).
Let us start with the change in financial condition of small businesses by examining sales/revenues/receipts for small businesses. The table below highlights that a smaller percentage of small businesses reported an increase in sales/revenues/receipts at the end of the 2nd quarter compared to the end of the 1st quarter. Interestingly, the biggest decline in percentage occurred for the biggest size category of small businesses (100-249 employees).
With the decline in the percentage of small businesses reporting increased sales/revenues/receipts, all business size categories now have less than 20% of businesses experiencing an increase in sales/revenues/receipts. The second table shows that the two biggest business categories experienced an increase in the percentage of businesses reporting a decline in sales/revenues/receipts at the end of the 2nd quarter compared to the 1st quarter.
The bottom four business size categories all experienced a decrease in the percentage of businesses reporting a decrease in sales/revenues/receipts. Even though the four smallest business categories experienced a decline in the percentage of businesses experiencing declining sales/revenue/receipts, the reality is that the bottom three categories still have close to 30% of businesses who experienced a decline in sales/revenues/receipts.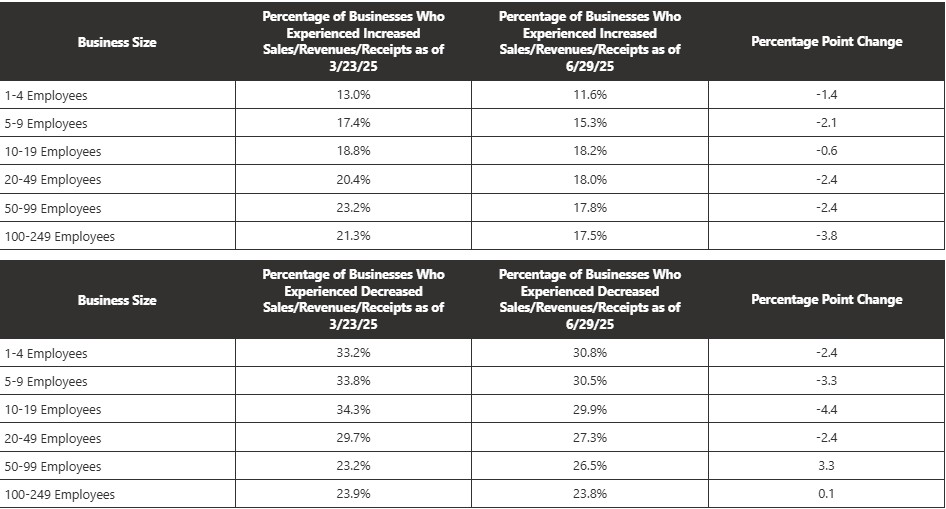
If we want to gain further insight into the change in financial condition of small businesses, we can examine the change in the price of the supplies that they must buy versus the price that they can charge for their finished goods and services.
The relatively good news is the fact that a smaller percentage of small businesses reported an increase in the cost of their supplies in the 2nd quarter. That does not change the fact that there are still between 30% to 43% (rounding) of small businesses who are experiencing an increase in the cost of their supplies.
The 50-99 Employees category was the lone category that experienced a higher percentage as of 6/29/25 compared to 3/23/25.
Although small businesses experienced a decrease in the percentage of businesses that paid more for the supplies at the end of the 2nd quarter compared to the end of the 1st quarter, the second table shows that all categories of business size experienced a decline in the percentage of businesses who were able to raise the price of their finished goods and services. 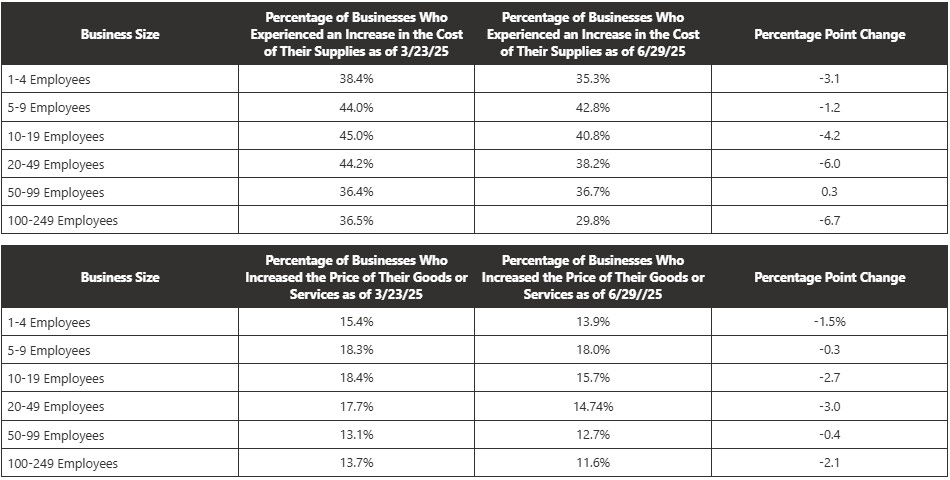
When all business size categories have a higher percentage of businesses paying more for their supplies than businesses able to raise the price of their finished goods and services, the implication is that profit margins are being hurt, unless they are reducing operating and overhead expenses.
Let us look at one of the biggest expenses for a business-wages. The survey does not explicitly cover changes in wages, but it does cover changes in the number of employees and hours worked.
A potential sign that a business is trying to offset the margin pressure from paying higher prices for supplies but not being able to offset by charging higher prices for its finished goods and services would be a reduction in staff or a reduction in hours worked by staff.
The first table below does not show evidence of that happening yet. As the table shows, all business size categories, except the largest, experienced an increase in the percentage of businesses increasing their number of paid employees.
The second table shows that a smaller percentage of businesses are decreasing staff, except for the largest size category again.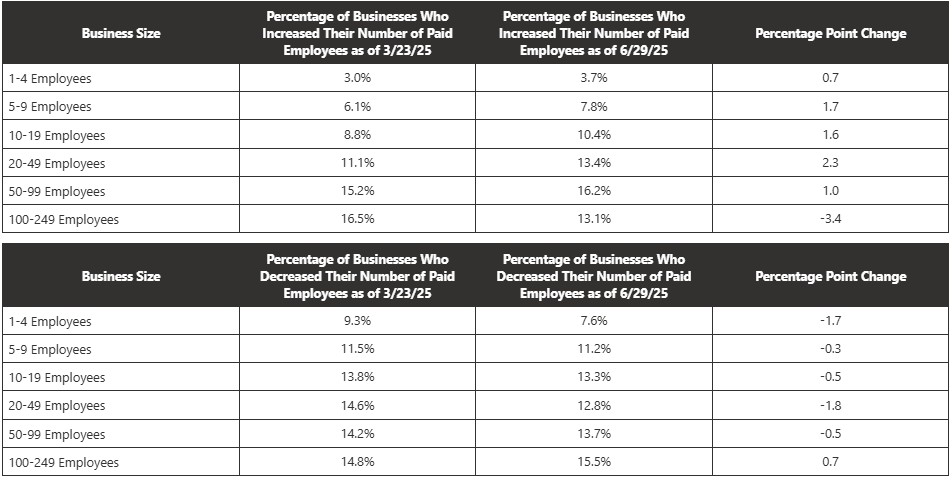
If we examine the hours worked, what is discovered is a mixed set of results. Three business size categories experienced a decrease in the percentage of businesses increasing the hours worked for their paid employees while three business size categories experienced an increase.
Four out of six business size categories had a decrease in the percentage of businesses reducing hours worked for their paid staff. Only one size category had an increase in the percentage of businesses decreasing hours and one category was unchanged.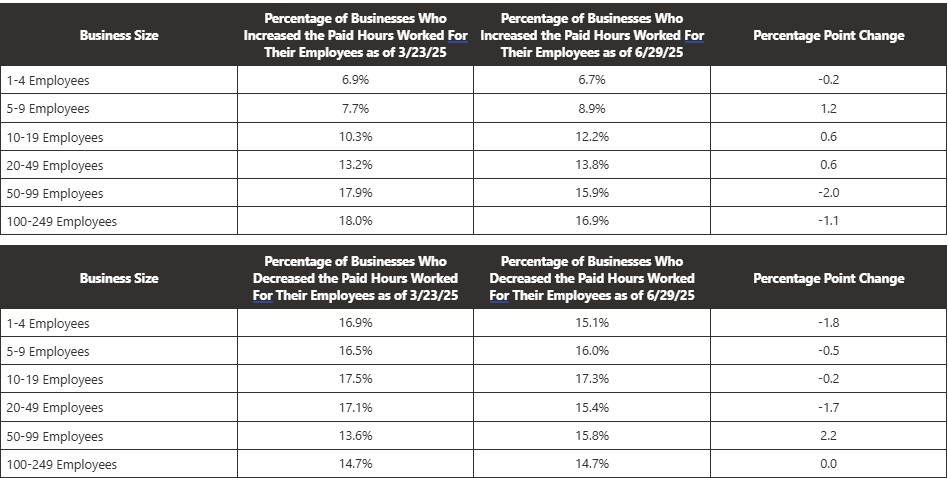
From a macro perspective, the survey results do not show a strong picture of improvement or deterioration. In general, the trend between the end of the 1st quarter and 2nd quarter was a decline in the percentage of small businesses experiencing an increase or decline for each category being measured. That means that a higher percentage are experiencing no change.
The data continues to highlight that profit margins may be under pressure for small businesses as 30% or more of small businesses are still experiencing a rising cost of supplies. That is not good news since less than 20% are able to raise the price of their finished goods and services.
From an employee perspective, the data provides two pieces of relatively good news. From a simplistic viewpoint, if you are looking for a job, you should focus on companies with 5-49 employees. Those were the three size categories that experienced an increase in the percentage of businesses increasing staff.
For existing employees, you benefited from increased hours worked to boost your income if you worked for a company that employs 50-99 employees. If only finding a job or more hours worked were that simple, which we all know it is not.
The 3rd quarter should provide more clarity around the areas of fiscal policy that are creating uncertainty. President Trump has extended the deadline for trade negotiations to 8/1/25 but has stated that this is the last extension. If true, small businesses should then know what the cost of the tariff tax will be and plan for it.
It could be an interesting quarter as tariffs threaten higher expenses for small businesses while some components of the One Big Beautiful Bill Act (OBBBA) should benefit small businesses. I will revisit the BTOS report at the end of the quarter to examine changes that occurred during the quarter.
Disclosures
The data comes from the Census Bureau's Business Trends and Outlook Survey.

Steve is the Economist for Washington Trust Bank and holds a Chartered Financial Analyst® designation with over 40 years of economic and financial markets experience.
Throughout the Pacific Northwest, Steve is a well-known speaker on the economic conditions and the world financial markets. He also actively participates on committees within the bank to help design strategies and policies related to bank-owned investments.