


Economic Summary
It was a busy week for economic data. The picture being painted by this week's data is that despite the noise and uncertainty around fiscal policy, the economy continues to grow. On the consumer side, sentiment improved, and spending continued. The University of Michigan Consumer Sentiment Index improved from 60.7 to 61.8.
On the consumer spending side, retails sales rose 0.6% for the month of June and 3.9% on a year-over-year basis. Consumers apparently decided they needed a new vehicle in order to go shopping for summer clothes and to pick up building and gardening supplies for projects at home. Motor Vehicle and Parts sales rose 1.2% in June, Clothing and Accessories sales rose 0.9% and Building and Garden Supplier sales rose 0.9%.
Consumers may have been more focused in making improvements on their existing homes rather than buying a different home because the Mortgage Bankers Association reported a 10.0% decline in Mortgage Applications last week. Mortgage applications to buy a home led the decline as they dropped 13.4% while applications to refinance fell 7.4%. A slight rise in the 30-year mortgage rate may have contributed to the declines as the rate rose from 6.77% to 6.82%.
Although some industries had layoffs (technology being the standout example), overall, companies remain reluctant to lay off staff. This is evidenced by the fact that Initial Jobless claims declined for the second week in a row. Initial claims fell 7,000 last week compared to the week before. The story remains the same which is if you do get laid off it is taking longer to find a new job This can be seen in the fact that Continuing Jobless Claims rose by 2.000 compared to the week before.
Manufacturing activity also showed improvement. The New York Federal Reserve reported a solid increase in manufacturing activity in its region. Its Empire Manufacturing Index rose from -16.0 reading in May to +5.5 reading in June. The Philadelphia Federal Reserve reported an even stronger improvement in its manufacturing activity as the Philadelphia Manufacturing Index rose from -4.0 to +15.9.
The one set of economic data which did not improve was the Consumer Price Index (CPI). Price increases related to tariffs started to show up in the data. The CPI rose from 2.4% on a year-over-year basis in May to 2.7% in June. The Core CPI index rose from 2.8% to 2.9%. The news was better for businesses as the Producer Price Index (PPI) slowed. PPI rose 2.3% on a year-over-year basis in June compared to 2.7% in May. Core PPI rose 2.6% compared to 3.2%.
Perspectives
The Bureau of Labor Statistics released the latest inflation data this week. With talk still swirling around the potential impact of consumers prices I thought it would be a good time to re-examine the inflation data. Specifically, today's Perspectives section examines the components of inflation that the average consumer most likely cares about the most. Inflation remains on the radar for the average worker as they continue to face the challenge of dealing with the higher prices that result from inflation. This can be seen in the fact that the Bureau of Labor Statistics reported a 0.4% decline in real average weekly earnings (i.e., earnings growth after inflation) in June. This means that price increases outpaced wage increases in June. This is only one month of negative wage growth but worth monitoring.
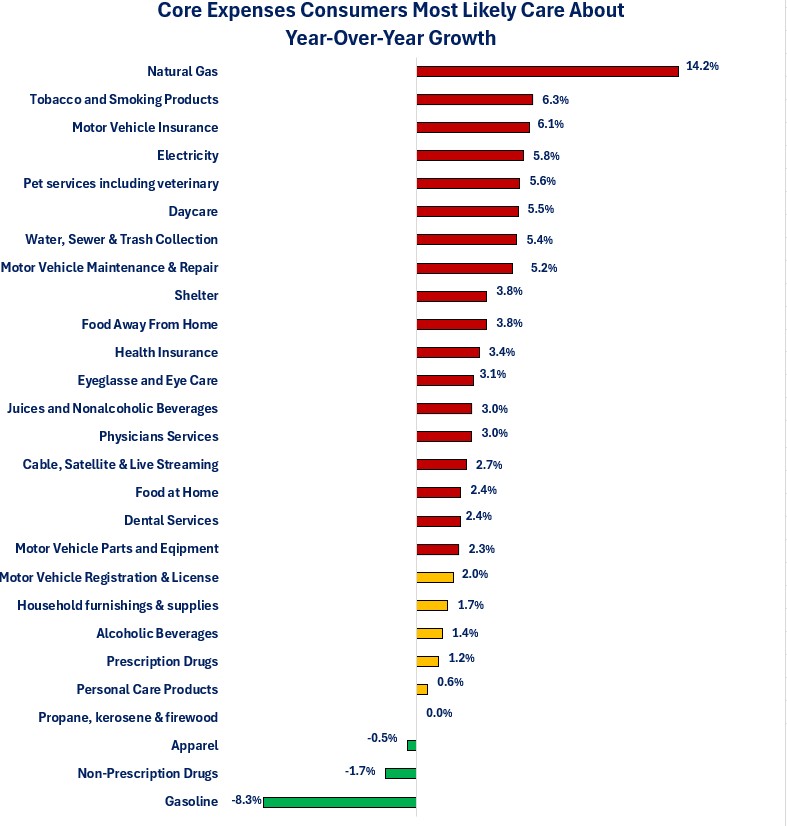
To understand the impact of inflation on consumers, it is necessary to examine consumer inflation rather than the official inflation results. To illustrate the type of inflation the consumer is facing, I went through the data and identified twenty-seven categories that most likely affect the average consumer. That does not mean that all consumers spend on all these categories. Let us examine the results.
In the graph below, any category with a red bar experienced a year-over-year growth in prices above the Federal Reserve's 2.0% target. Gold bars are categories that experienced increases between 0% to 2.0% and categories in green had negative growth.
As you can see, 18 out of the 27 categories experienced price increases above 2.0%. Six categories had price increases between 0% and 2.0% and three categories saw prices decline.
For working couples with kids, the hit to their paycheck was probably more painful than those without kids as daycare costs rose 5.5%. It was probably worse if they had an infant in daycare. For those families with school-age kids, the encouraging news is that apparel prices declined slightly so back-to-school apparel shopping should be similar to last year. That may not be much, but you take the small savings when you find them.
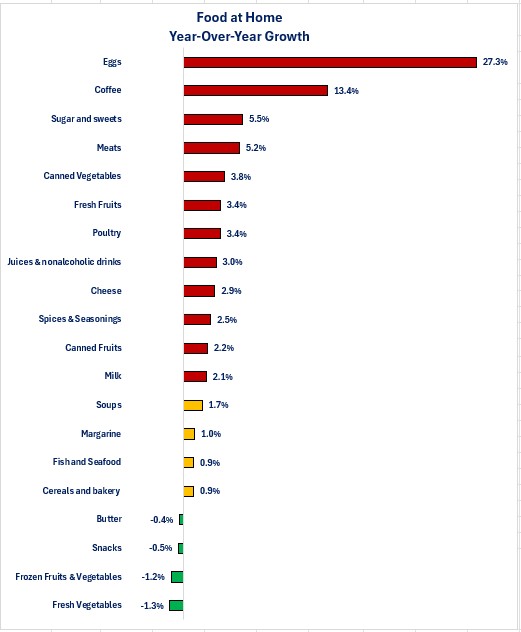
One category that may have the most focus from consumers is Food at Home (i.e., groceries). The next graph breaks down the Food at Home category into its major components to shed some light on what is happening with grocery prices.
Even though politicians may be touting how egg prices have fallen from their peak prices, the reality is that egg prices still increased 27.3% compared to June of last year. For the Food at Home category, 11out of the 19 categories experienced a growth in prices greater than 2.0%. Four categories had growth between 0.9% to 1.7% and four categories saw price decreases. People who need their caffeine hit to start their day may want to switch to the caffeinated non-alcoholic drinks given the difference in growth rate!
The graphs highlight the fact that most consumers are probably not experiencing the official inflation rate as the types of goods and services that may be part of their “core” expenses are seeing more price increases above 2.0% than below. Consumers may shake their heads when they hear politicians or economists arguing that inflation is under control and wonder “what world are they living in?”
In addition to the fact that you do not buy everything that is included in the official inflation rate is the fact that the weighting for the goods and services you buy most likely do not match what is used to calculate the official inflation rate. The standout example of this is the Daycare category. The BLS data shows that the Daycare category makes up less than 1% (0.73%) of the inflation calculation. For many families, daycare costs are their second or third biggest expense. For couples with no kids in daycare the weighting is zero.
Age can also make a difference in your inflation rate. For young adults, it may be rent, or student loan payments may have the biggest impact on their overall inflation rate. For young families it may be rent or daycare. For middle-aged couples with kids, it may be mortgage payments and college expenses while for older couples it may by medical or insurance expenses. The point is that your inflation rate is unique to you, and you are not crazy when you hear or read about the official inflation rate and think “that's not what I am experiencing.” Most people don't even think in terms of a personal inflation rate. Instead, they think about how much prices have gone up and the impact those price increases are having on their life.
The reason we care about inflation is that it can be the force that causes consumers to dramatically slow their spending. This is especially true if expense growth is outpacing your income growth. A consistent pattern of this happening could cause consumers to stop buying certain items because they can no longer afford them due to increases in prices of other “must spend” categories. An inflation problem will impact spending at the lowest income levels first since they have lower earnings to deal with price increases and no additional income that higher income consumers may have (i.e., investment income and interest income). For those lower income consumers that receive government transfer payments to help them make ends meet, any reductions in those payments may result in more reductions in their spending. Since consumer spending accounts for close to 70% of US economic growth any factors that could slow spending are a risk to the economy.
I am not trying to make an argument to ignore the official inflation rate since it does not reflect your inflation rate. The official rate is used in different parts of the economy including monetary policy. When the Federal Reserve is determining with the 2.0% inflation goal has been met, it is using the two official inflation rates (CPI and PCE) to measure whether that goal has been achieved. Some contracts have price increases built in that are tied to one of the two official inflation rates and some sources of income (like Social Security) use the official inflation rate to determine the change in income levels each year. The takeaway from today's article are:
-
It would be a mistake to believe that inflation is not a problem for consumers because the official inflation rates are now below 3%.
-
When it comes to understanding the impact of price increases on consumer spending, the official inflation rate may not be a good indicator to use.
-
You are not crazy when you don't believe the official inflation reflects your person inflation rate.
Disclosures
The data is from the Bureau of Labor Statistics and is as of 6/30/25.

Steve is the Economist for Washington Trust Bank and holds a Chartered Financial Analyst® designation with over 40 years of economic and financial markets experience.
Throughout the Pacific Northwest, Steve is a well-known speaker on the economic conditions and the world financial markets. He also actively participates on committees within the bank to help design strategies and policies related to bank-owned investments.