


Economic Summary
Overall, this week's economic data showed signs of the economy slowing but still growing.
- The Kansas City Federal Reserve's Manufacturing Index fell to -3 from a +5 level in June.
- The Richmond Federal Reserve's Manufacturing Index deteriorated further as the index fell from -8 to -20 and S&P Global's manufacturing PMI fell from 52.9 to 49.5. A reading below 50 for this index indicates that activity was contracting.
- After a 16.5% surge in May, Durable Goods Orders fell 9.3% in June.
- Core Durable Goods Orders rose 0.2% compared to +0.6% in May. The Conference Board's Leading Index fell 0.3% after being unchanged in May.
- MBA Mortgage Applications barely registered an increase as applications rose 0.8% last week compared to a 10.0% decline the week before. Application for refinance fell 2.6% while applications to purchase a home rose 3.4%. The 30-year mortgage rate was 6.84% compared to 6.82% the week before.
- Existing Home Sales fell 2.7% in June after rising 1.0% in May.
- New Homes Sales rose 0.6% in June after falling 11.6% in May.
- The Department of Labor reported a decline of 4,000 in Initial Jobless Claims last week. This continues the pattern of recent declines.
- Unfortunately, for those that are already unemployed, finding a new job continues to be a struggle. This was evidenced by the fact that Continuing Jobless Claims continued its recent pattern of increases. Continuing Jobless claims rose 4,000.
Perspectives
Last week's Perspectives section examined the reality of what the consumer is experiencing for price increases for their core expenses versus the official inflation numbers. This week's Perspectives section examines what type of price increases businesses are experiencing.
The Bureau of Labor Statistics publishes the Producer Price Index (PPI) which covers prices for goods and services that a business may buy. There are two components of the PPI report:
-
Prices for intermediate demand.
-
Intermediate demand captures the price changes for goods and services as they progress from raw materials to a final product or service. An example of this would be a steel mill that sells steel to a machinery manufacturer and the machinery manufacturer builds an engine that it sells to an auto company.
-
-
Prices for final demand. The final demand is when the automobile company sells the finished car to an auto dealer. When the auto dealer sells the car to a consumer, that is part of the Consumer Price Index.
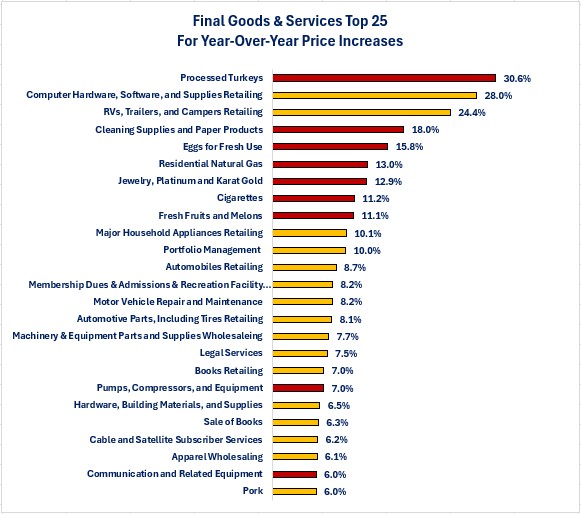
This week's analysis will focus on the inflation rate for the Final Demand Goods and Services categories because this is the purchase price that a business is going to pay before they sell it to a customer. Let us start by examining the 25 categories that had the biggest year-over-year price increases. In the graph below gold bars are categories in the service sector and red bars are categories in the goods sector.
What you can see from the graph is that 16 out of the top 25 categories (64%) are in the service sector. More specifically, there are 4 out of the top 25 categories (16%) that are food related. That is good news for parts of the agriculture sector but not good news for restaurants and grocery stores if they are buying agricultural items with big price increases.
-
Turkeys
-
Eggs
-
Fresh Fruits and Melons
-
Pork
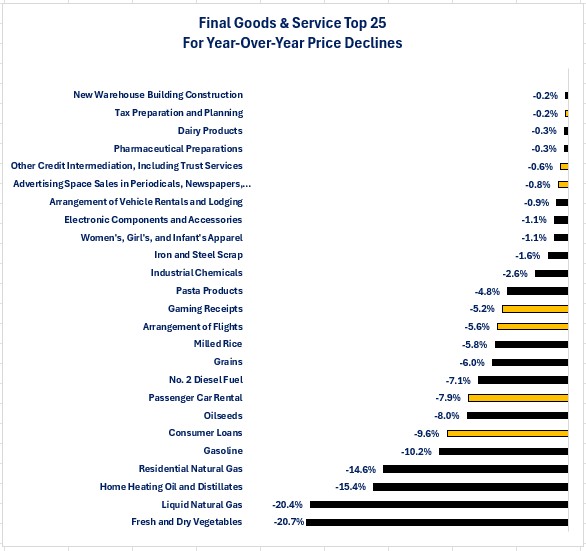
Now let us see which categories were the top 25 for the biggest year-over-year price declines. The gold bars represent service sector categories and the black bars are goods sector categories. The first thing that stands out is that the size of the price decline is far smaller than the price increase. All the top 25 categories for price increases had at least 6.0% year-over-year increases. For the top 25 prices declines, 15 categories had price declines that were less than 6.0%. The graph also shows the majority of the price declines happened in the goods producing sector as 18 out of the top 24 categories (72%) were goods producing categories. The food sector once again had the most within the top 25 as 6 out of the 25 were in the food related categories. That is not good news for parts of the agriculture sector but may be good news for the restaurant and grocery store industries if they are buying the items that had the price declines.
-
Dairy Products
-
Pasta Products
-
Milled Rice
-
Oilseeds
-
Grains
-
Fresh and Dry Vegetables
The analysis of the business inflation rate is not an “apples to apples” comparison of last week's analysis for the consumer, but it does shed light on the real inflation occurring for many businesses.
It is not immediately obvious as to which side of the economy (goods producing versus service providing) is experiencing the highest or lowest inflation. That is because a product could be on the goods producing side through the intermediate production steps but end up on the service side for the final demand.
-
Motor vehicles are an example of this. As discussed at the beginning of this analysis, the process of producing raw material, manufacturing all the parts, and assembling the car or truck falls on the goods producing side.
-
Once the motor vehicle is finished and sold to the auto dealers, it moves to the service side because the auto dealer does not make the product. They simply provide the service to the consumer of the car/truck buying process.
The BLS does identify inflation rates for producers that are producing goods versus services through the intermediate processes to help us at least get a macro view of the differences. The table below shows the inflation rates for goods and services producers as well as the total inflation rate at each step of the process. Stage 1 is the beginning of the process; Final Demand is the end of the process.
What you can see is for most stages of “production,” prices have risen faster for goods producers but at the final stage, it shifts to the service side. Once again, that may be because the final demand (before selling to the consumer) is someone like an auto dealer who is being hit with the cost of the inflation that flowed through the intermediate processes.
Although not specifically identified, the higher inflation rates through the intermediate processes could well reflect the impact of the tariff taxes. 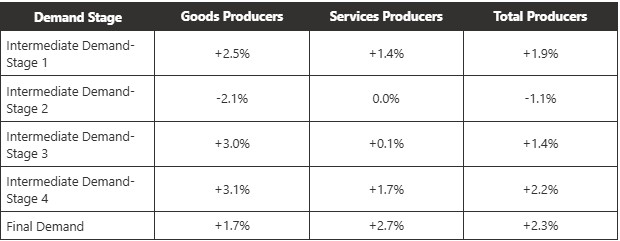
For many small businesses, these price increases add financial stress. The challenge is whether they can pass on the higher costs to maintain their profitability or else sell out to a bigger business or simply close their doors if they are no longer profitable. General Motors may be able to sustain a $1.1 billion hit to their earnings due to the new tariff taxes, but small businesses may not be able to absorb the cost of higher taxes. Tariff taxes are not the only new tax hitting businesses as many states (including Oregon and Washington) have raised taxes on businesses to fill budget deficits.
The takeaway from this analysis is the same as what was discussed last week for the consumers:
-
Not all businesses are experiencing the same inflation rate, and it is highly likely that none of them are experiencing the official inflation rate.
-
Small businesses may be impacted far more than big businesses.
Disclosures
All data is from the Bureau of Labor Statistics as is as of 6/20/25.

Steve is the Economist for Washington Trust Bank and holds a Chartered Financial Analyst® designation with over 40 years of economic and financial markets experience.
Throughout the Pacific Northwest, Steve is a well-known speaker on the economic conditions and the world financial markets. He also actively participates on committees within the bank to help design strategies and policies related to bank-owned investments.