


Economic Summary
This was a light week for economic data, especially following last week’s busy calendar.
Last Week:
We first learned that the Fed’s preferred measure of inflation (Core Personal Consumption Expenditures) climbed by 0.3% on the month, and to 2.8% on a year-over-year basis. We also received the first estimate of second quarter GDP, which reflected economic growth of 3% following the first quarter’s contraction of -0.5%. The positive print surpassed expectations of only 2.3% and reflected a reversal of the primary drag in the 1st quarter – which was a 37% surge in imports. It also pointed to consumer strength as spending rose by 1.4%, much better than the 0.5% pace in the 1st quarter. Still, growth for the second half of the year registered only 1.2%. That compares to 2.7% for the second half of last year and 2.8% for the full year. So, turbulence and uncertainty from the new policy environment are now beginning to weigh (possibly materially) on the economy.
The Federal Reserve (Fed) also wrapped up another monetary policy meeting by deciding to keep the Fed funds rate where it is at 4.25-4.50%. With this, the Fed telegraphed that they’ll continue to hold tight with policy and monitor data in “wait and see” mode. Having said that, there were two dissenters among the 12 voters - Fed Governors Michelle Bowman and Chris Waller.
In a surprising turn of events, last Friday’s Nonfarm Payrolls report rattled the markets and questioned just how stable the labor market actually is. The report showed that we added only 73k jobs in July and what’s worse is that the prior two months’ numbers were both revised lower – much lower. May’s number was revised lower by 125k jobs to only 19k, and June’s by 147k to only 14k.
This Week:
We kicked off this week with Factory Orders for the month of June. Manufacturing continues to account for approximately 10% of the US economy and is under pressure from President Trump’s tariffs on imported goods. On Monday, we saw that new orders for US manufactured goods declined by -4.8% in June, largely due to a significant decline in commercial aircraft. June’s number followed an upwardly revised 8.3% surge in May.
On Tuesday we got another peek at trade and saw that Imports declined by -3.7% to $337.5 billion while exports declined by -0.5% to $277.3 billion. This resulted in the US trade deficit narrowing to $60.2 billion, which was the smallest deficit since September of 2023. Of note was that the largest deficit was with Mexico, though it narrowed slightly.
On Thursday we were able to get another look at the labor market, which pointed to additional evidence that it’s softening. Initial jobless claims (those filing for unemployment benefits for the first time) climbed by 7k to 226k. This was up from 219k in the prior week and beyond expectations of only 221k. While higher, initial claims remain in a fairly tight channel. Continuing claims (those who are out of work and still looking for work), on the other hand, jumped by 38k to 1.97mm – the most since November of 2021.
Perspectives
The last time we focused on the regional economies was at the end of the 1st quarter. We analyzed data as of 1/31/25 in an effort to provide you with a baseline for this year. Now that we’re more than halfway through the year, we thought it prudent to see what has changed since then. The short answer is some, but not much.
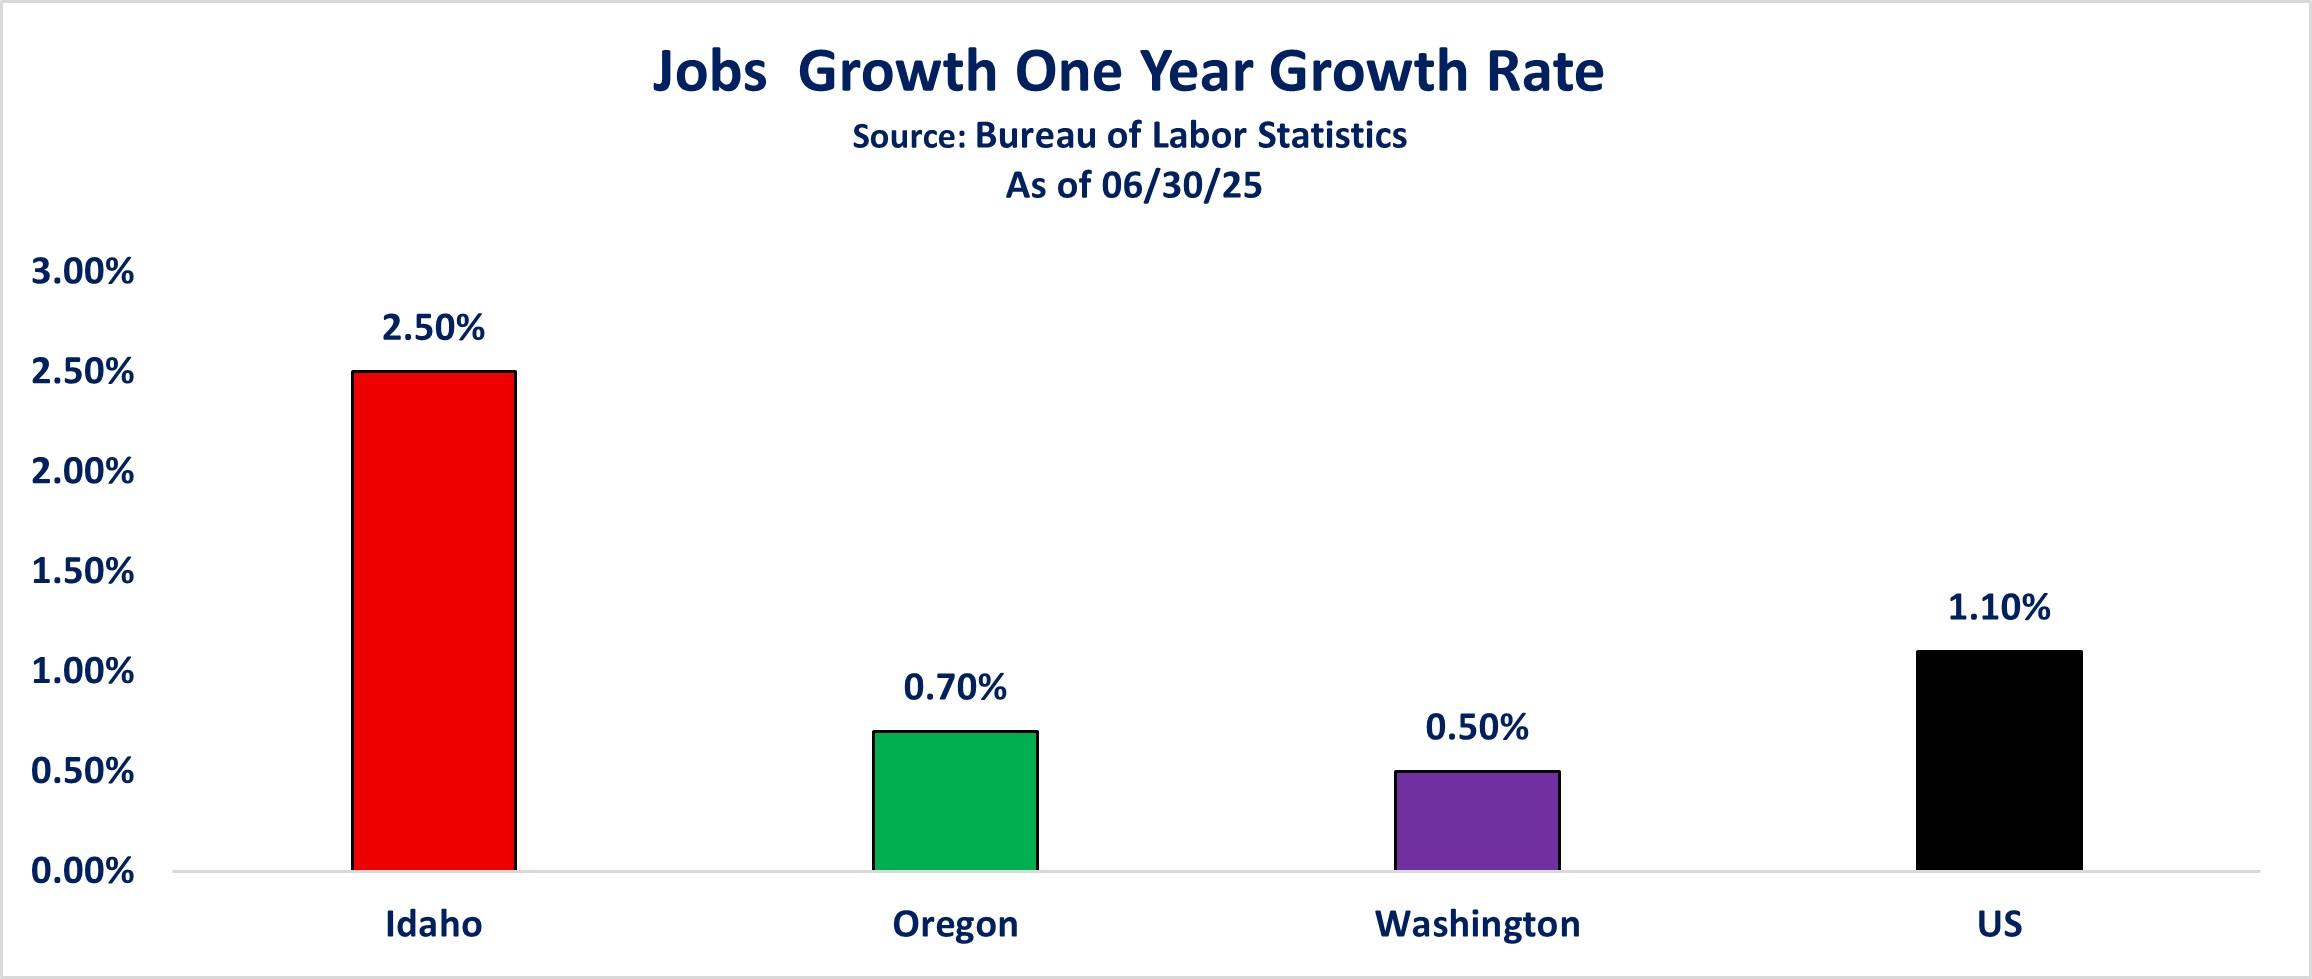
Like last time, we’re providing you with an updated economic snapshot for each of the three states Washington Trust Bank has a presence in — Idaho, Oregon, and Washington. The data I am sharing with you has been updated as of 6/30/25.
In this week's Perspectives I will cover:
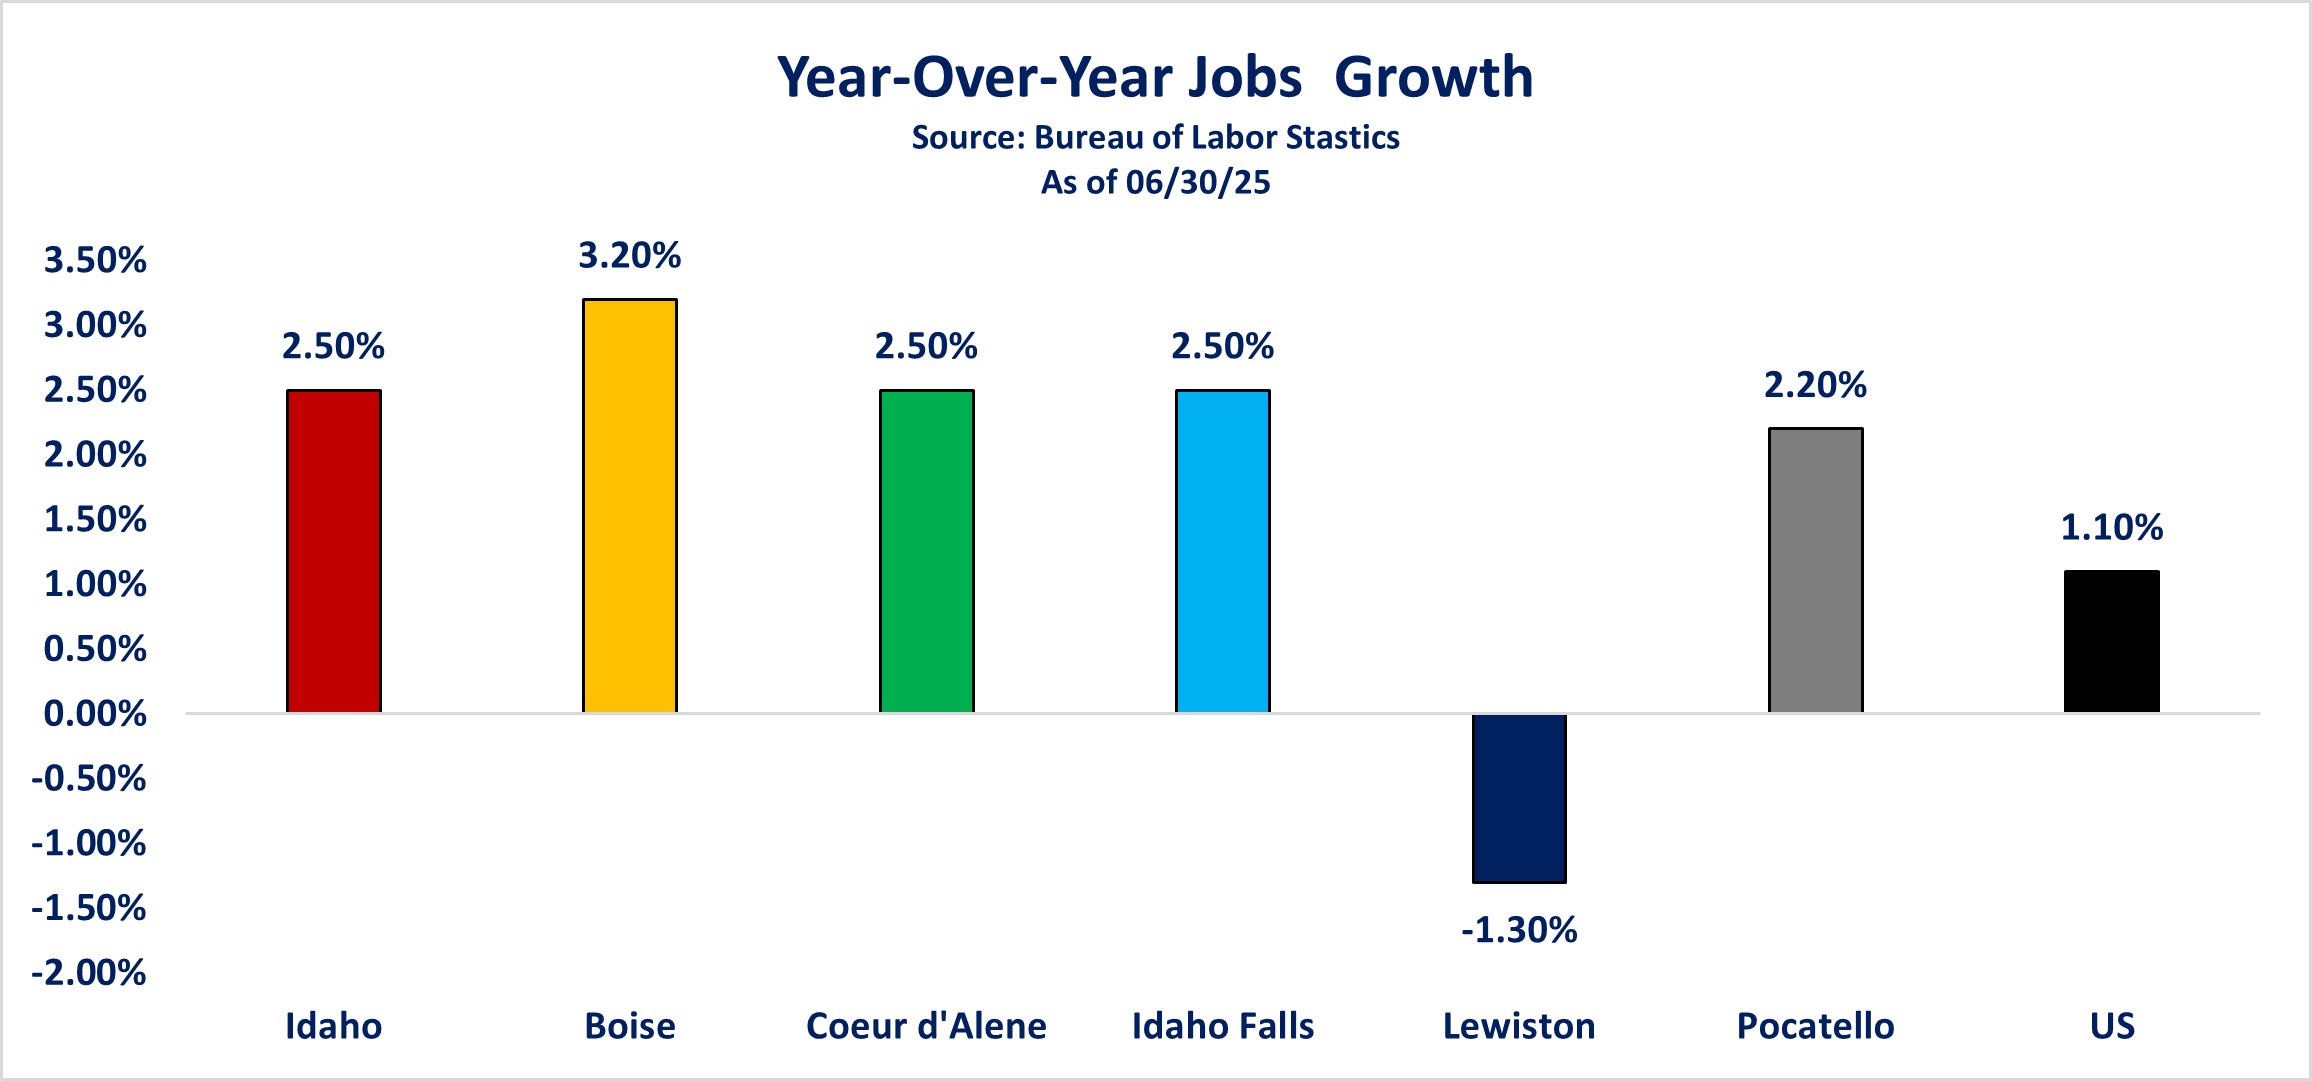
- Regional Jobs Growth
- Regional Jobs Growth by Industry
- Regional Wage Growth
- Regional Affordability
Soundbite
Last time around, we suggested that when looking at the economies within our regional footprint, location matters as does the eye of the beholder — at least when you consider a business owner versus that of an individual. Well, that is still very much the case.
Through the lens of an employer, lower wages continue to make Idaho an attractive place to operate a business. However, if you’re an individual, both Oregon and Washington are arguably more attractive places to be an employee, at least from a wage standpoint.
Another observation that still rings true is that no matter where one lives within our regional footprint, affordability (especially housing) continues to be a formidable headwind.
Observations
With the acknowledgement that all jobs are important, it’s also important to acknowledge that not all jobs are equal. Jobs in some industries offer higher levels of compensation than others – generally speaking. With a better understanding about what types of jobs are being created, it helps to achieve a better understanding about the consumer’s ability to spend.
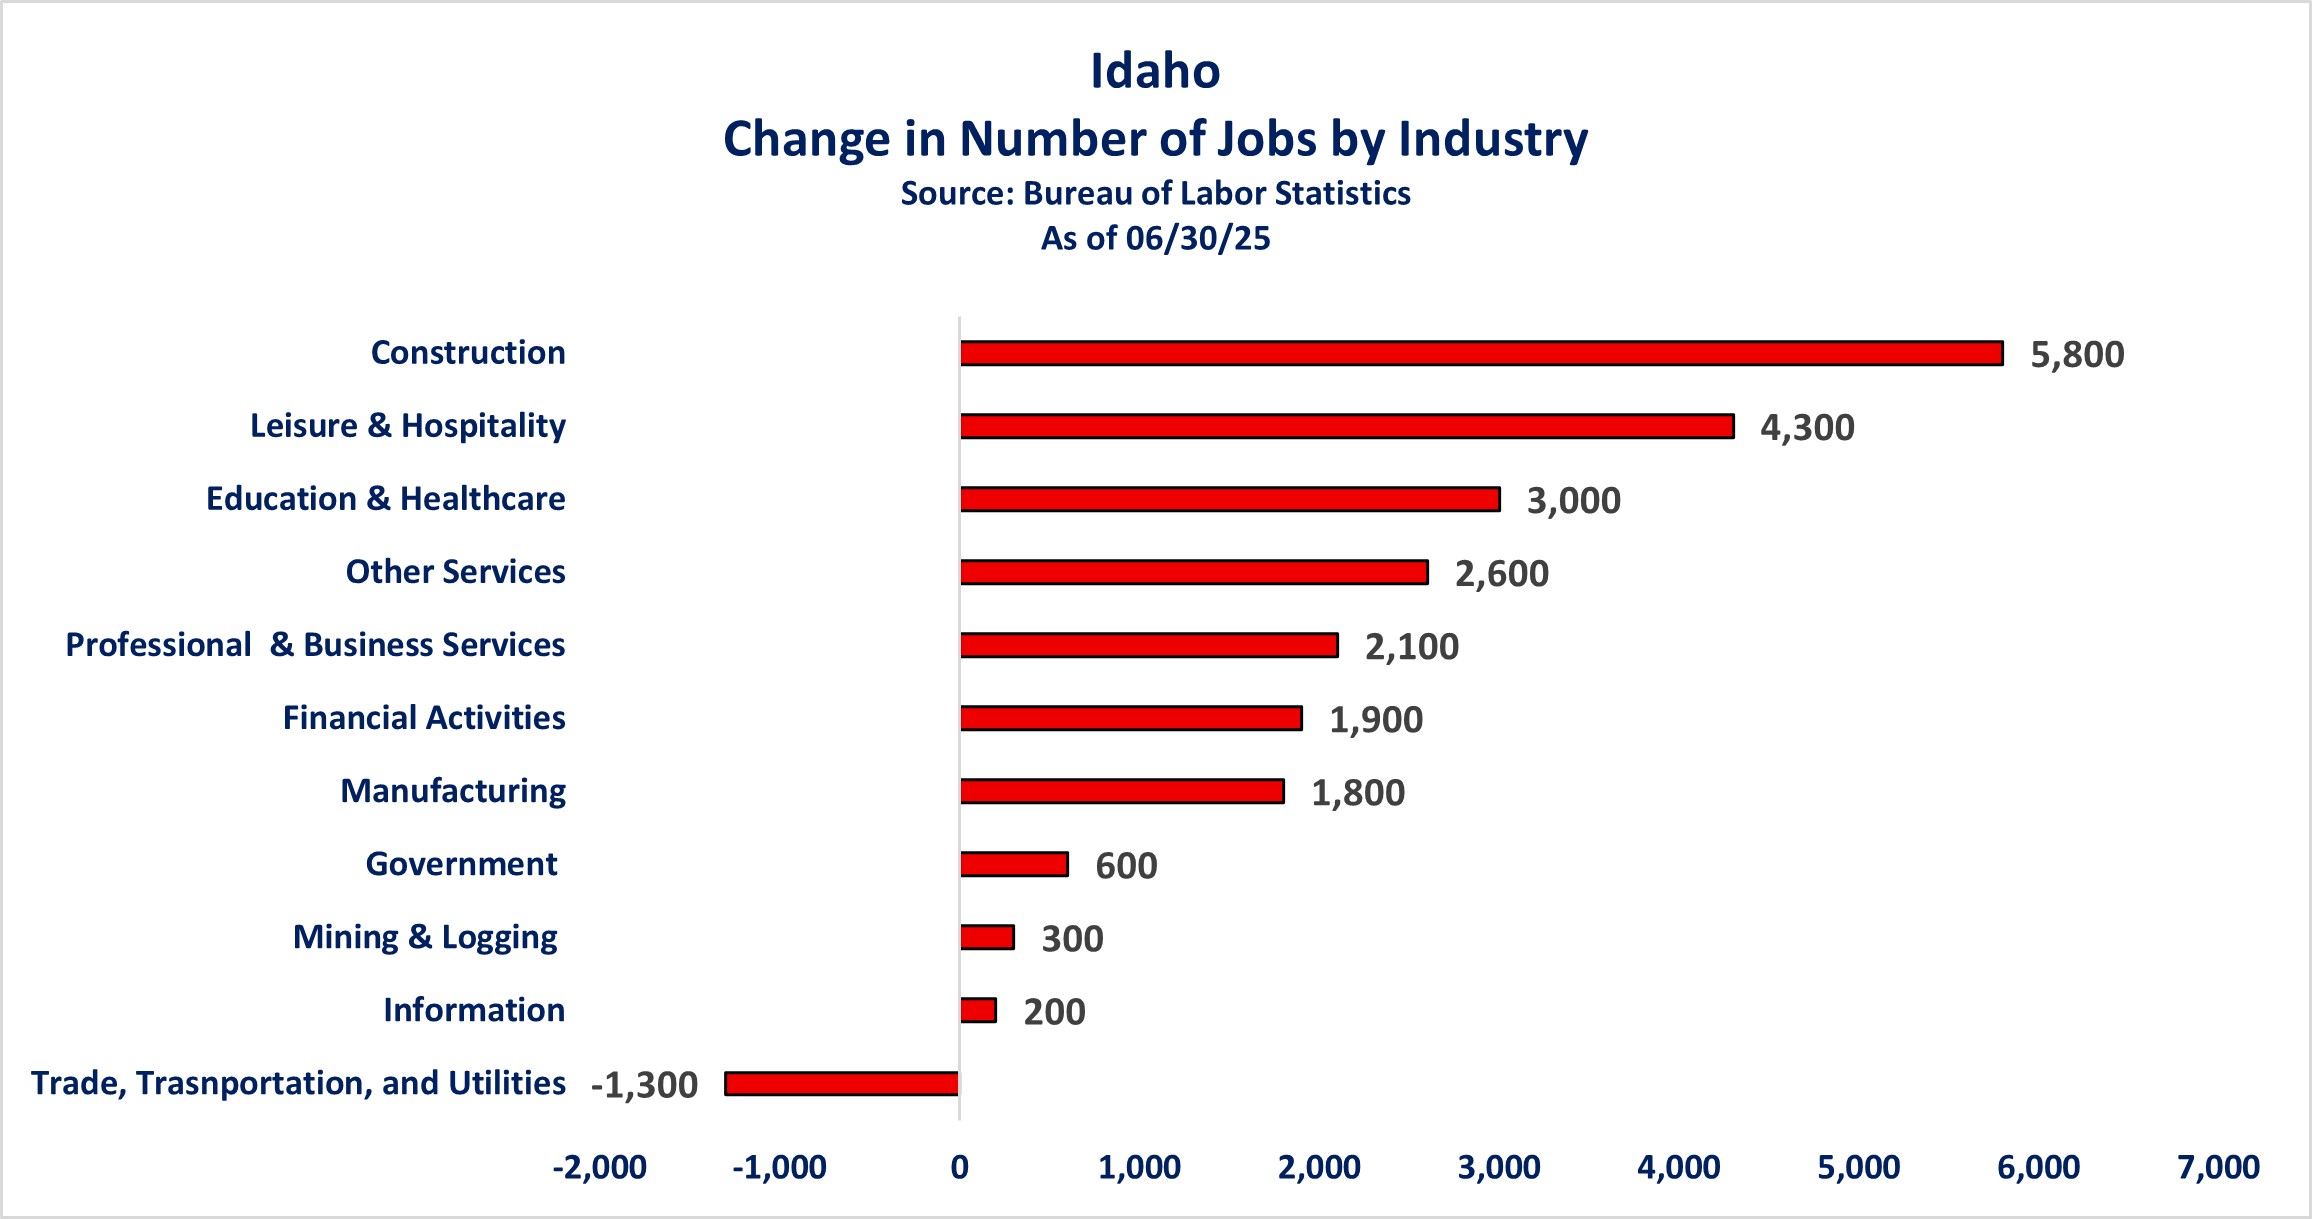
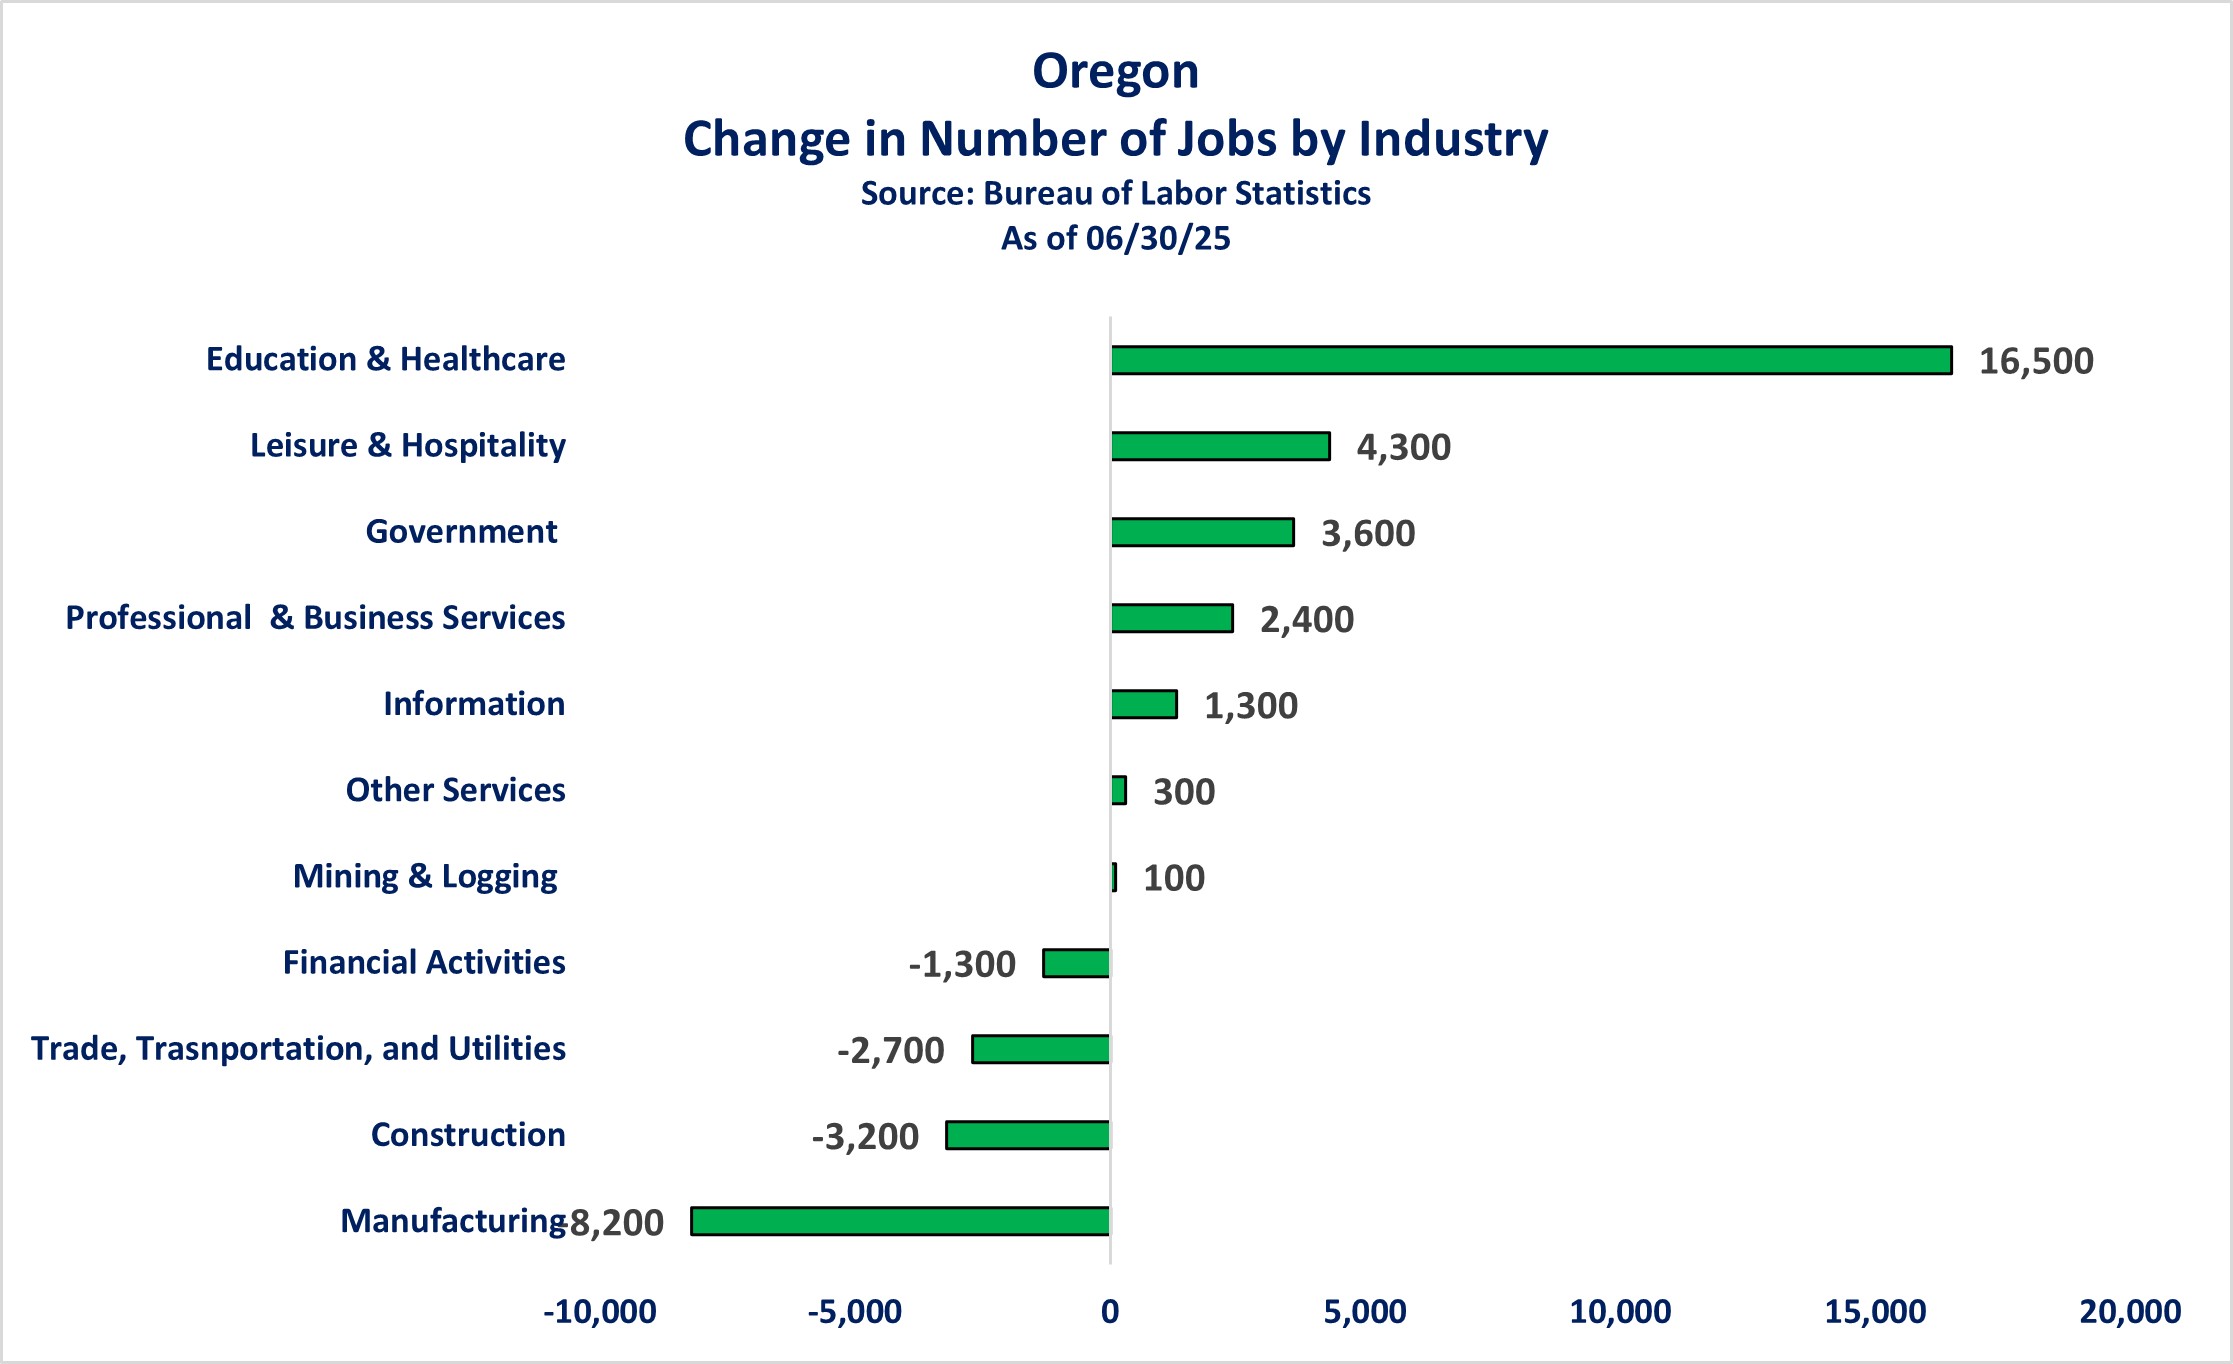
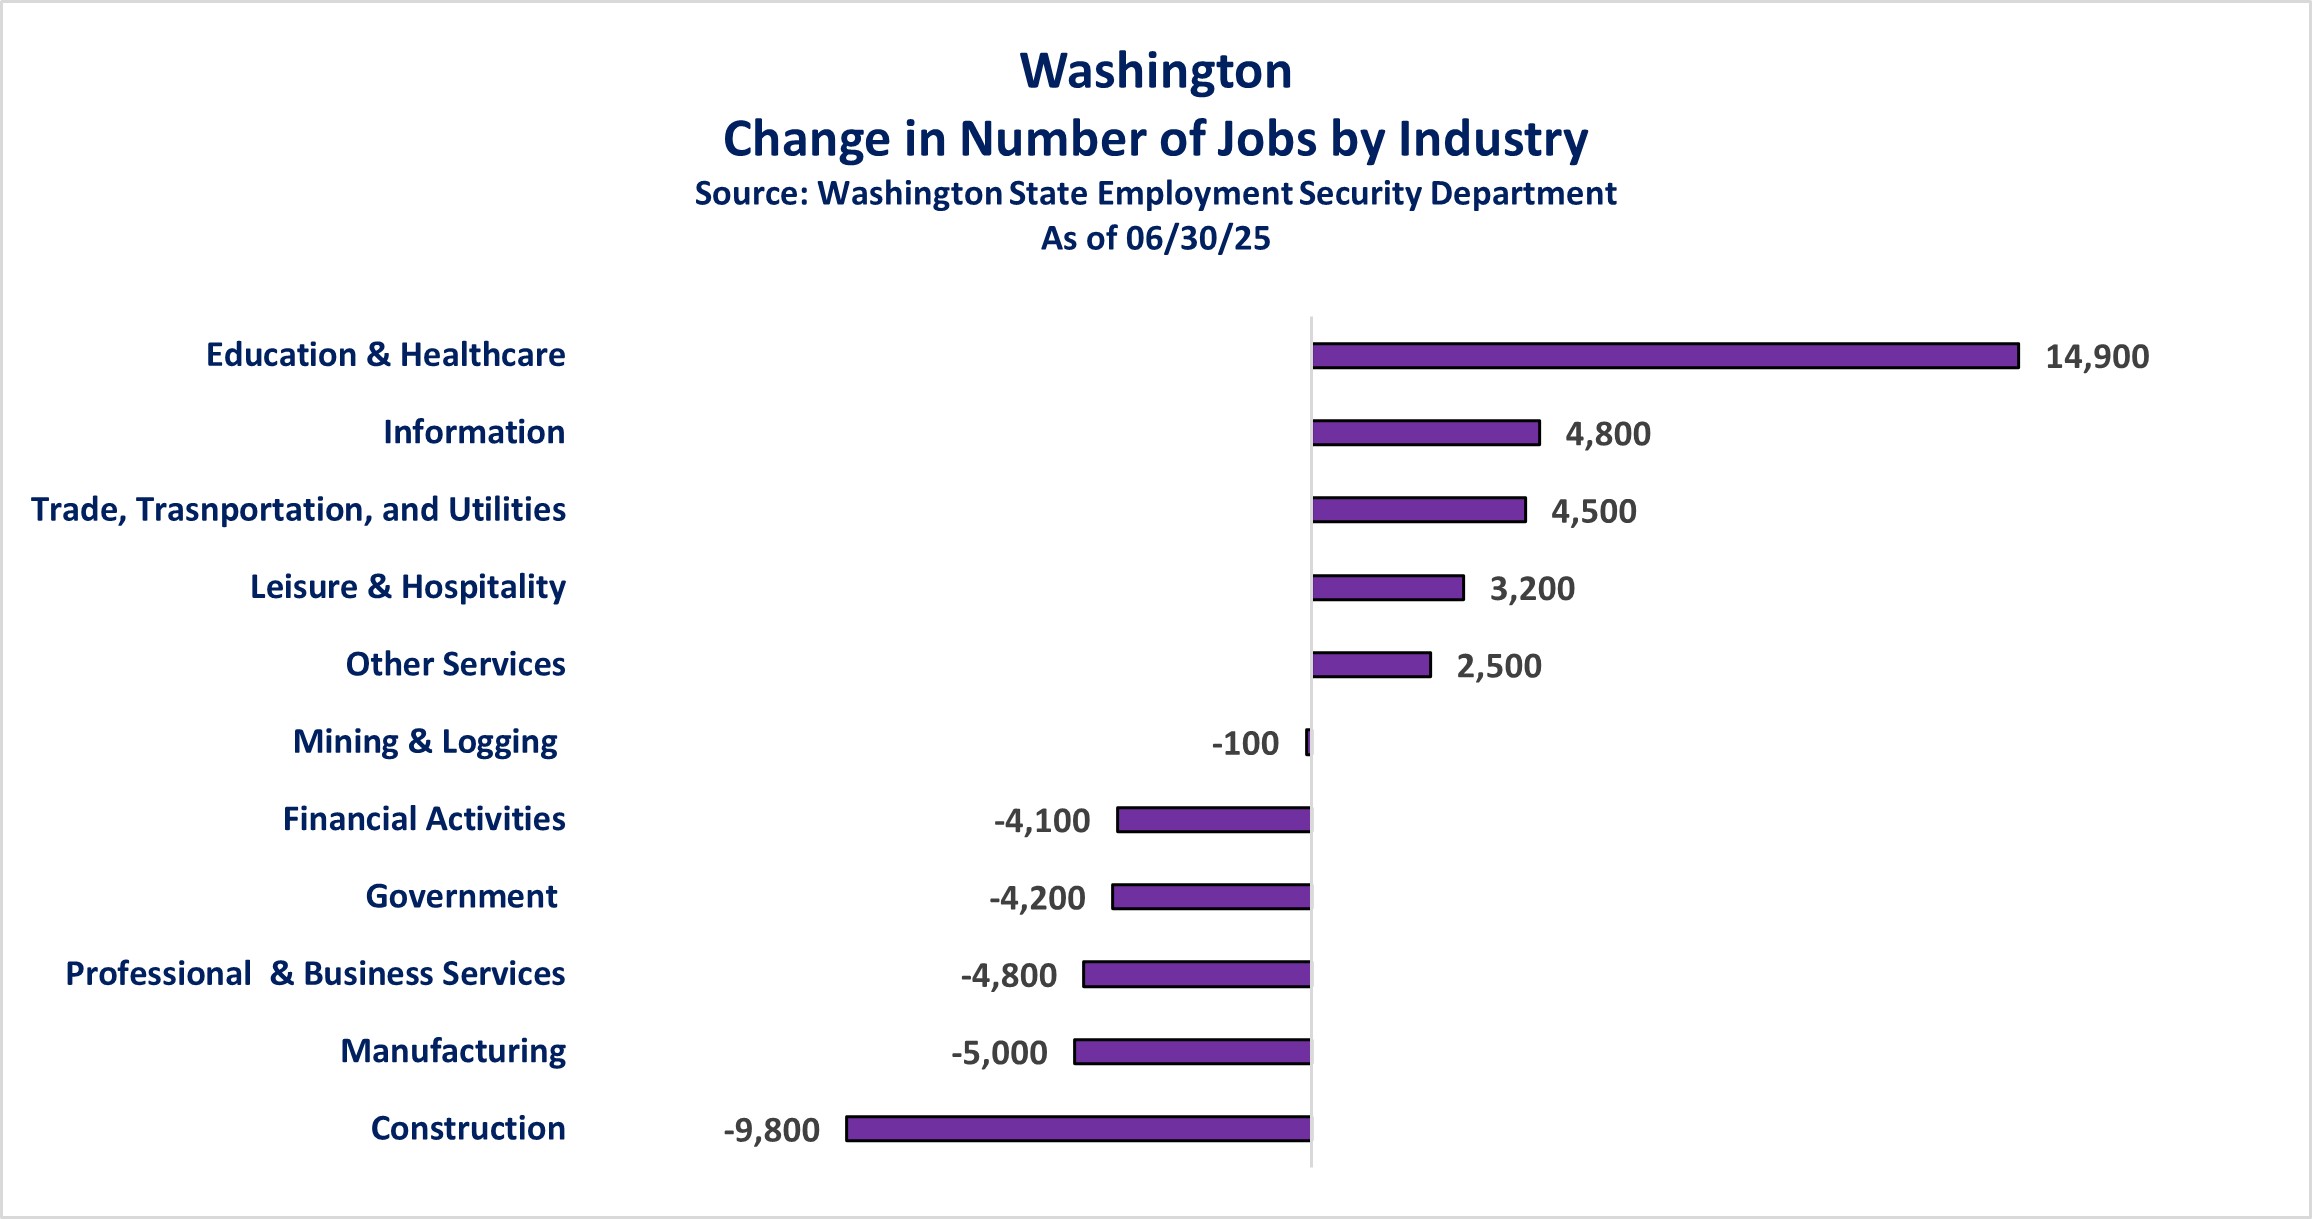
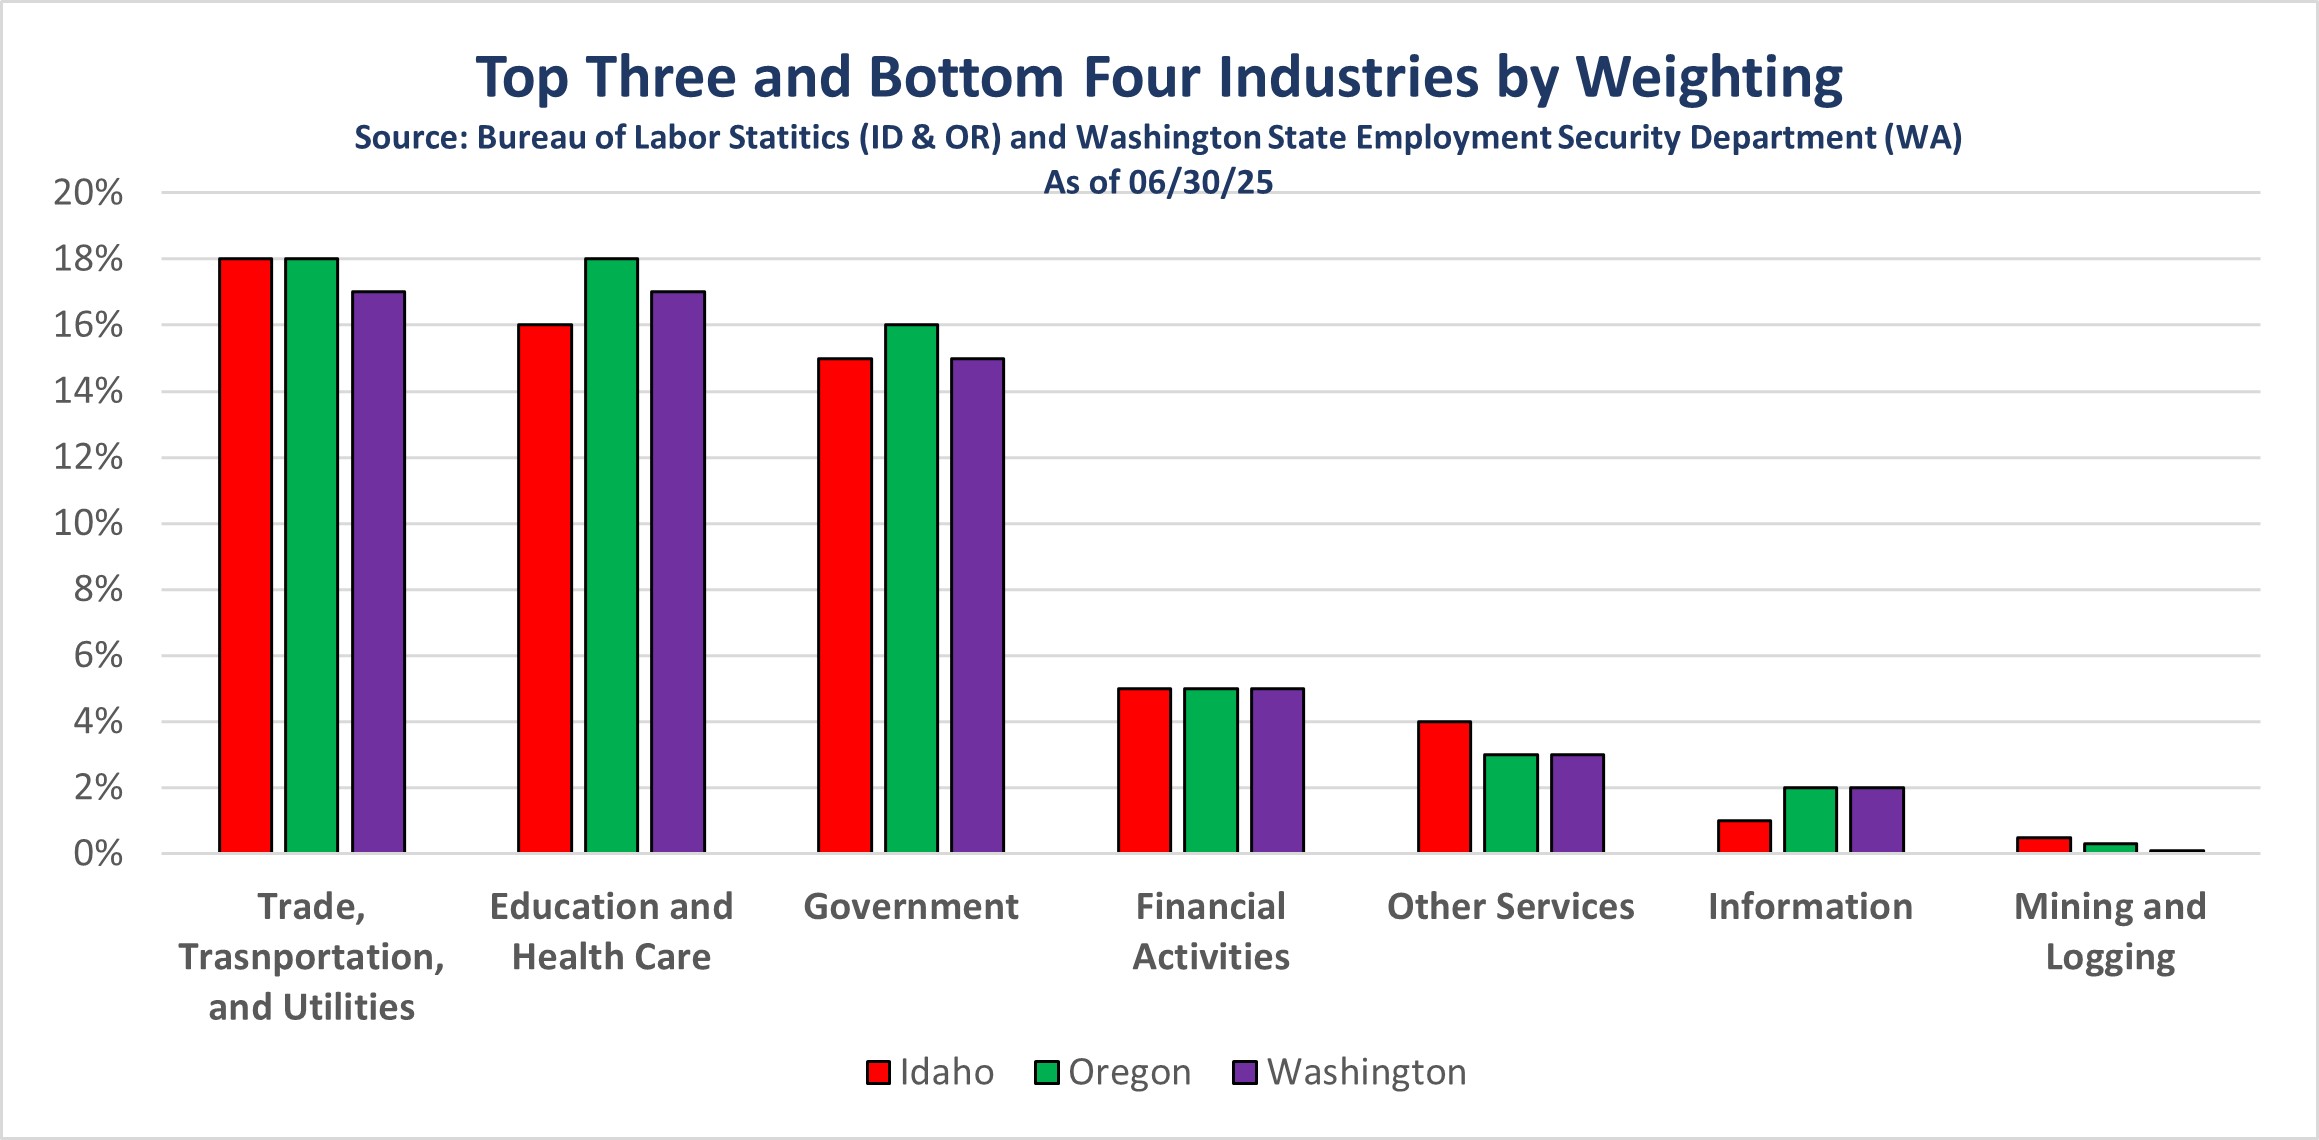
The bottom four industries are also still the same in each state. Notably, Mining and Logging, Information, and Financial Activities are all typically attractive industries from a wage perspective. While it’s nice to see jobs in these areas, they won’t really move the economic needle much because the number of jobs within these industries in each state are so much smaller by comparison.
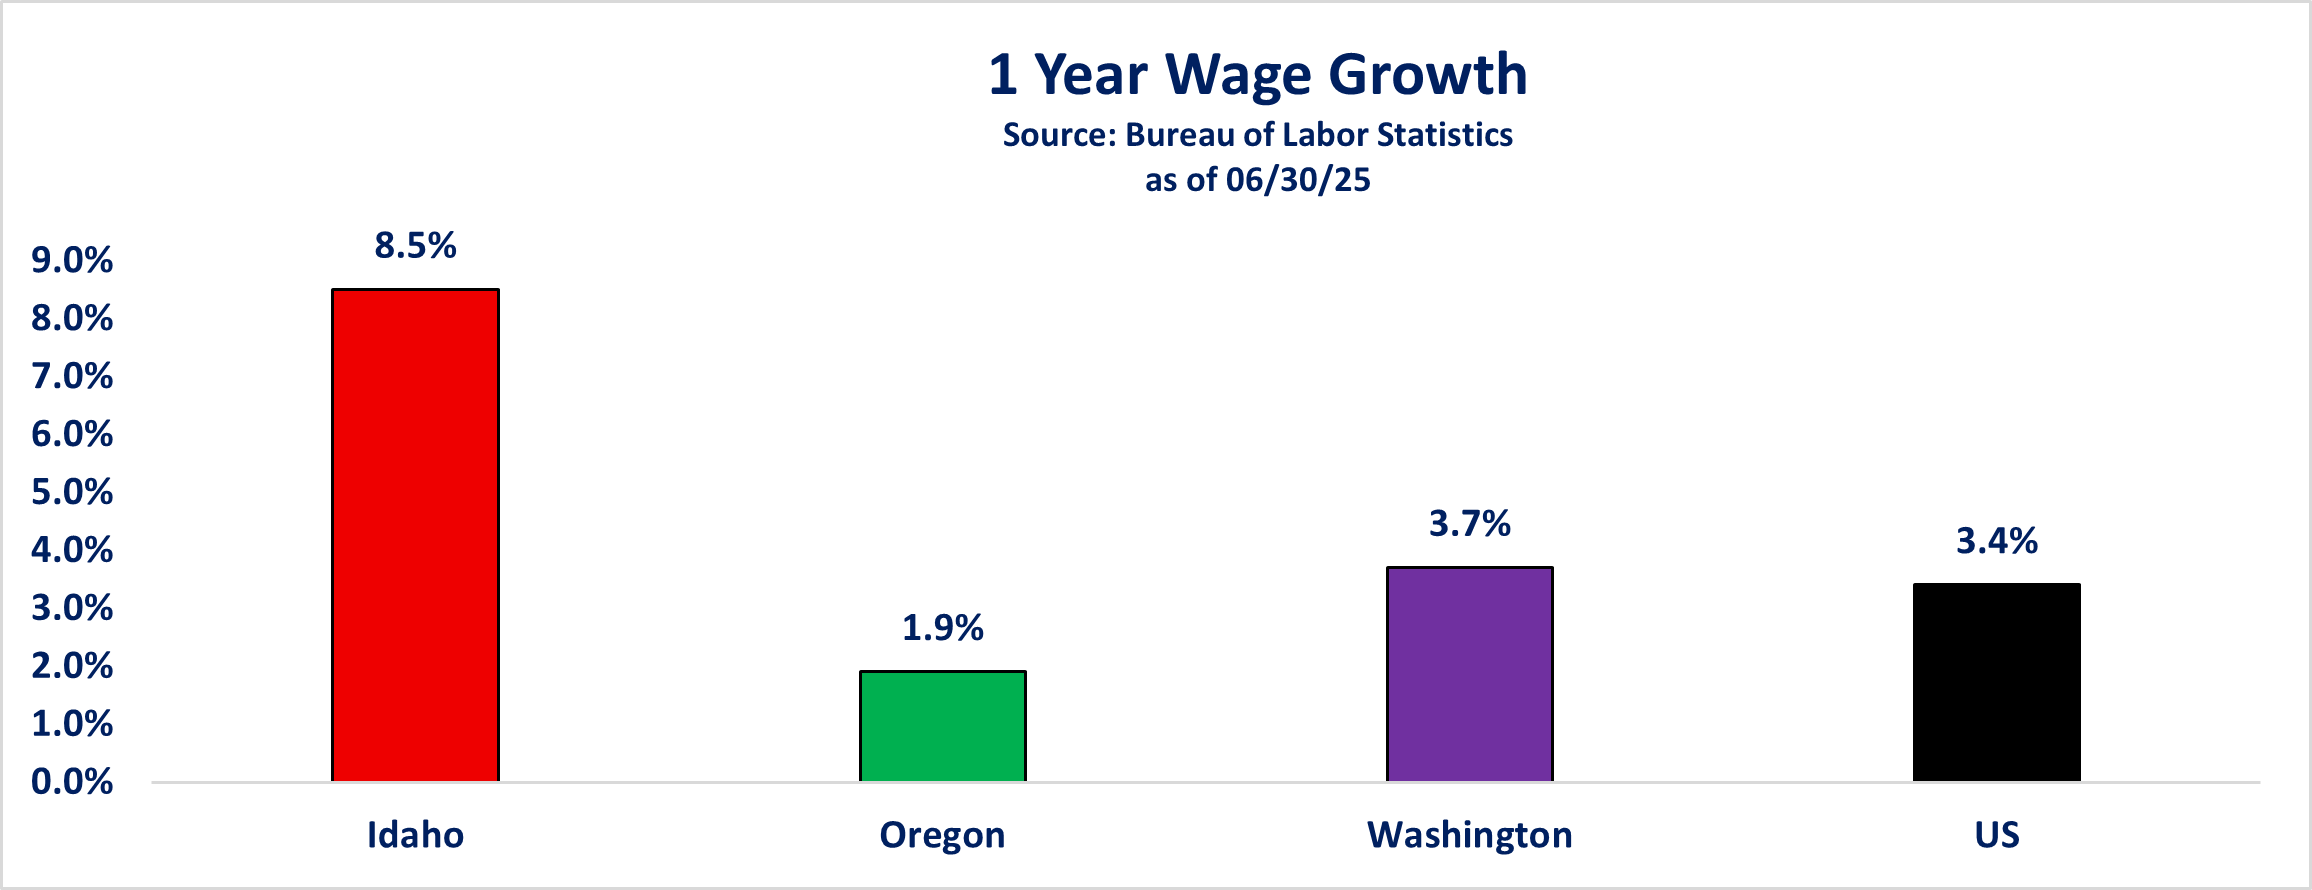
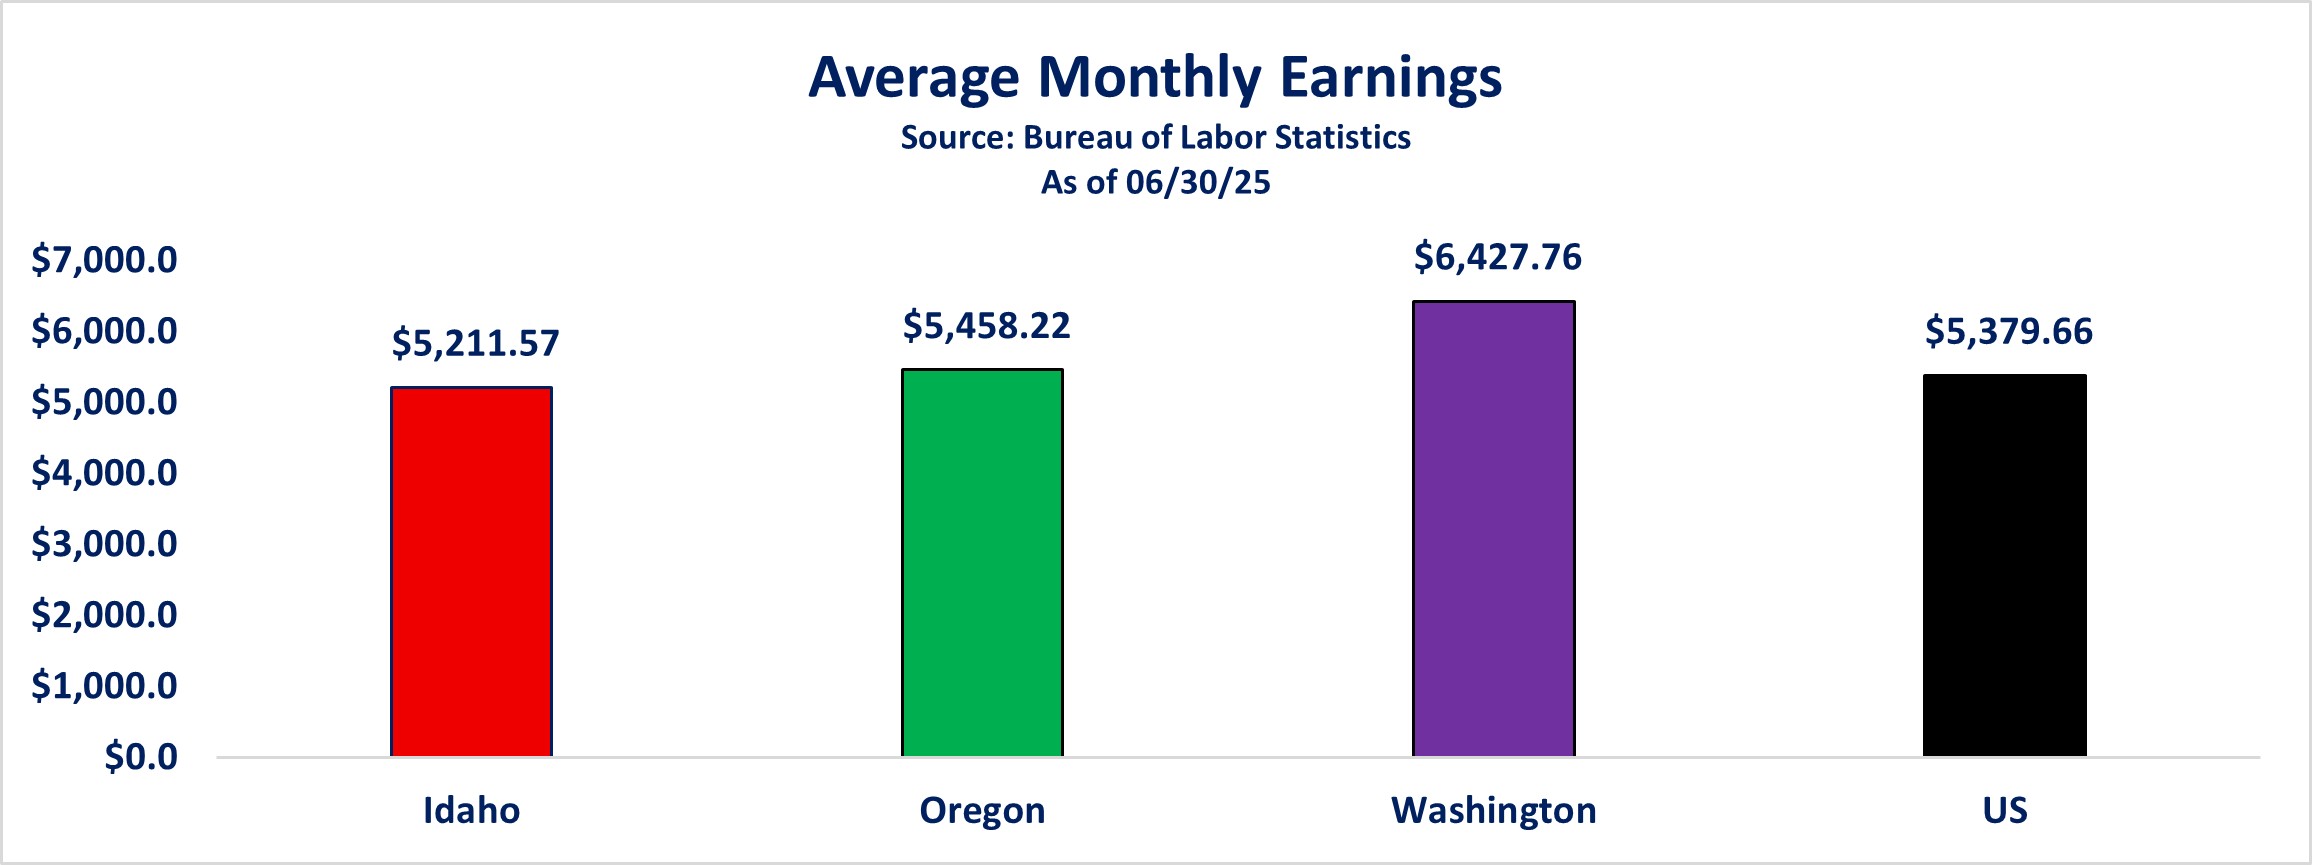
Considering everything I’ve shared with you already, if you’re an employer, Idaho still appears to be a very attractive place to operate a business. However, if you’re an individual, Oregon and Washington appear to be far more attractive as far as wages are concerned.
Through the lens of an individual looking for opportunity, they may be initially drawn to states with higher average wages – like Oregon or Washington. But is that really advantageous? Affordability (especially housing) continues to be top of mind for consumers as prices continue to rise.
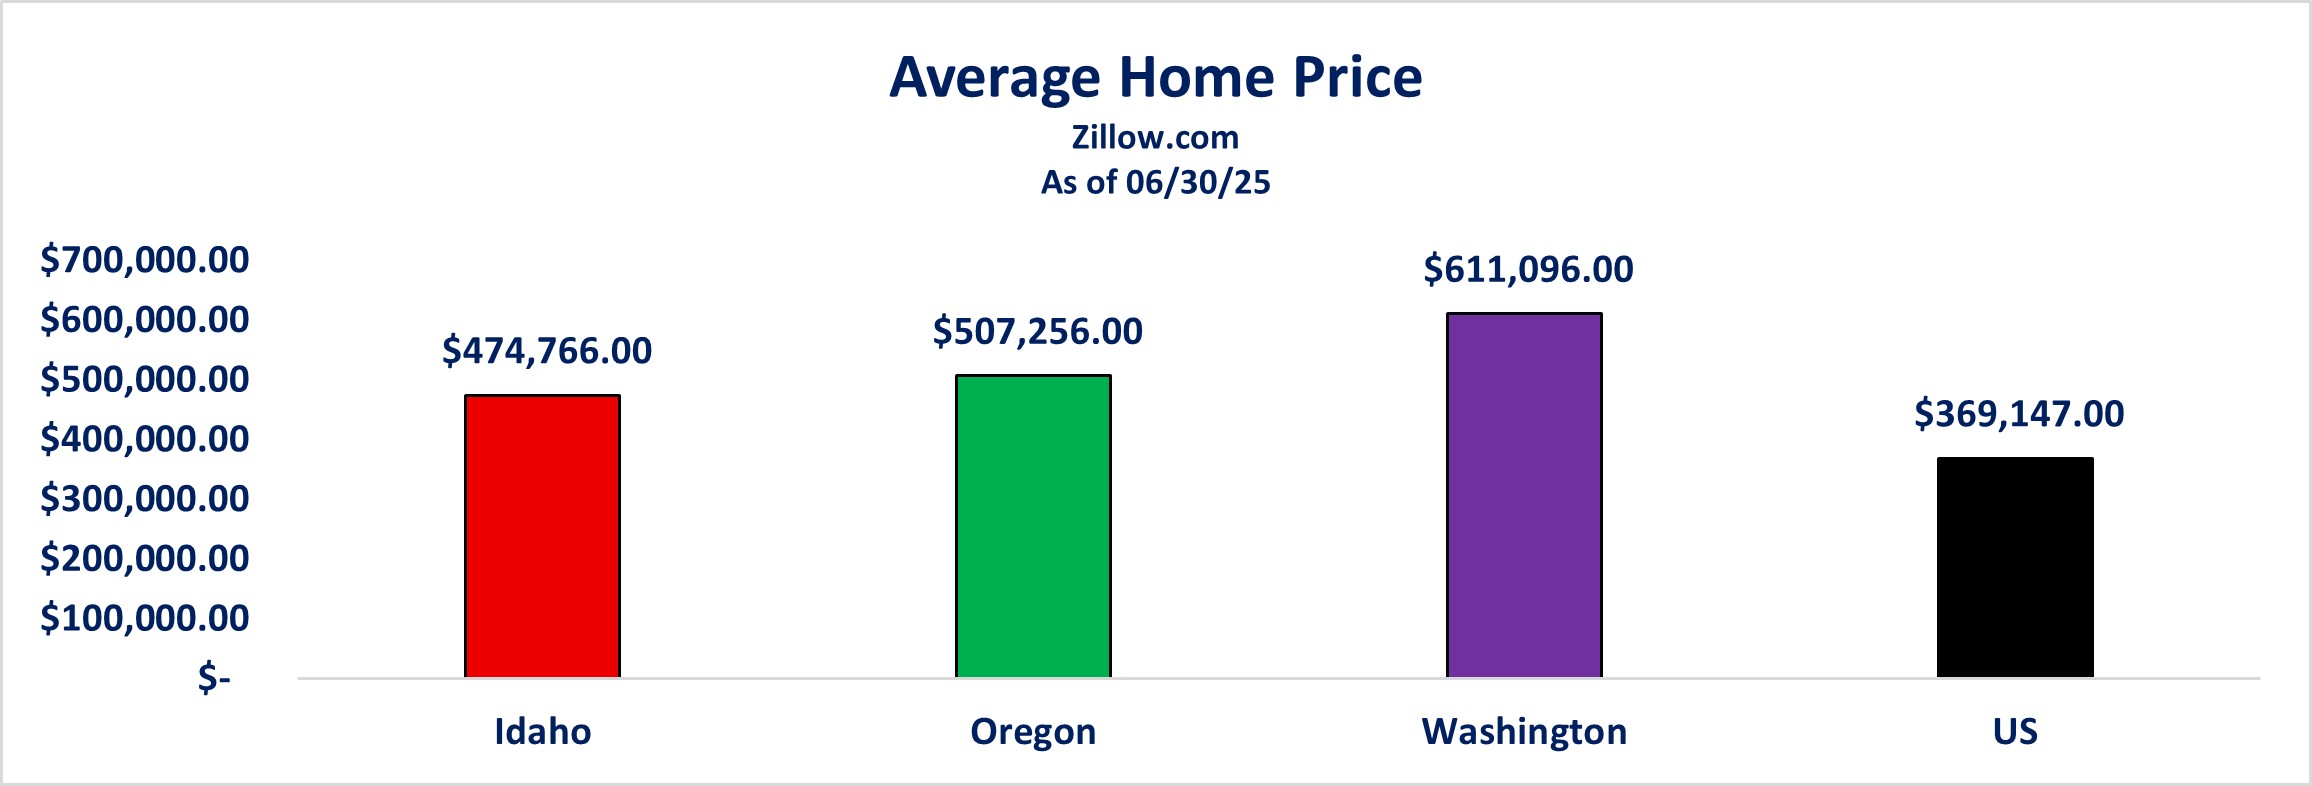
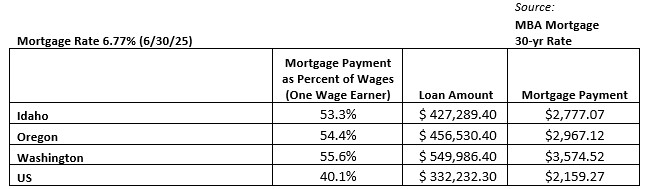
The average home price in each state still exceeds the national average by a fair margin, with Washington holding first place at $611,096, up from $596,514 in January. If we consider the average price of a home as well as the average monthly wage in each state, we are able to get a feeling for affordability. Assuming a down payment of 10% and a 30-year mortgage rate of 6.77% (as of 6/30/25), we are able to arrive at a hypothetical loan amount, monthly payment and more importantly, a ratio of the mortgage payment as a percentage of monthly wages (higher is worse).
Disclosures
- Bureau of Labor Statistics (BLS) report as of 6/30/25
- Washington State Employment Security Department as of 6/30/25
- Zillow as of 6/30/25

Senior Portfolio Manager