


Economic Summary
This week's economic data was another week of mixed results. The National Association of Home Builders (NAHB) reported a decline in optimism from builders. The NAHB Housing Market Index fell from 33 to 32. On the positive side, the Census Bureau reported a 5.2% increase in housing starts in July. The strength in housing starts came from the multi-family side as single family residence starts rose 2.8% and multi-family starts rose 11.6%. Future activity looked more concerning as building permits fell 2.8%. Single family permitting rose 0.5% but multi-family permits fell 9.9%. MBA mortgage applications fell 1.4% last week driven by a decline in applications to refinance. Applications to purchase were unchanged while applications to refinance fell 3.1%. The 30-year mortgage rate was essentially unchanged as the rate was 6.68% compared to 6.67% the week before. Existing home sales rebounded from a 2.7% decline in June to a 2.0% increase in July.
The Department of Labor reported an 11,000 increase in initial jobless claims last week. Initial jobless claims continue to remain with a range between 200,000 to 250,000. Continuing claims rose 30,000. This continues the trend where businesses are not initiating increased layoffs, as evidenced by the initial jobless claims data, but they are also not in a strong hiring mode as more people are needing ongoing unemployment benefits. Once you lose a job, it is taking longer to find a new one.
Data on the manufacturing side of the economy showed mixed results. The Philadelphia Federal Reserve Manufacturing Index fell from +15.9 in July to -0.3 in August while S&P global's manufacturing PMI rose from +49.8 to +53.3.
On the service side of the economy, the Philadelphia Federal Reserve's Services PMI barely fell as it dropped from +55.7 in July to +55.4 in August.
Finally, the Conference Board reported a continued decline in its Leading Index. The index fell 0.1% in July after falling 0.3% in June.
Perspectives
Last week's Perspectives section examined what was happening with lending standards for credit cards from banks. This week's Perspectives will examine who has credit cards and are carrying outstanding balances. This comes from the most recent Federal Reserve Survey on Consumer Finances. A caveat up front: the most recent credit card outstanding balances data are as of 12/31/22. The Federal Reserve conducts this comprehensive survey every three years so the next report will not be released until next year with data through 2025. Clearly, more recent data would be preferred but this is the most recent Federal Reserve data, and the information still provides valuable insights.
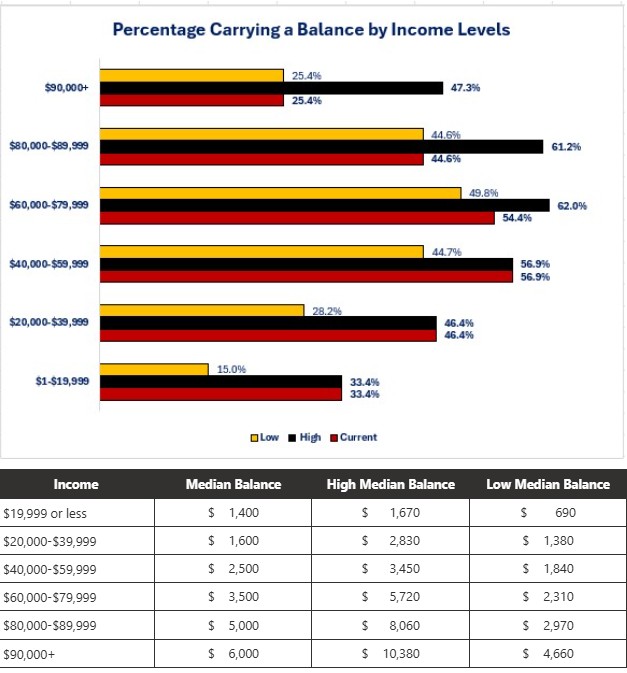
Let us start by examining what percentage of each income bracket carries a balance on their credit card(s). The graph below shows that the $40,000 to$59,999 income bracket had the highest percentage of people carrying a balance on their credit card(s) at 56.9%. The highest income bracket has the smallest percentage of people carrying outstanding balances (25.4%).
The concerning part of the graph is that the lowest three income brackets were at their highest percentage since 1989.
-
Under $20,000 = 33.4%
-
$20,000-$39,999 = 46.4%
-
$40,000-$59,999 =56.9%
That may provide evidence to support the narrative many economists put forward that, during the spike in inflation between 2020 to 2022, the lower income earners may have been forced to charge more expenses to their credit cards and make monthly payments since they could not afford to pay the total expense all at once.
The table below the graph shows the median outstanding balance on credit cards for each income bracket. The table highlights that, for those people who do not pay off their credit card each month, the higher the income level the higher the median outstanding balance.
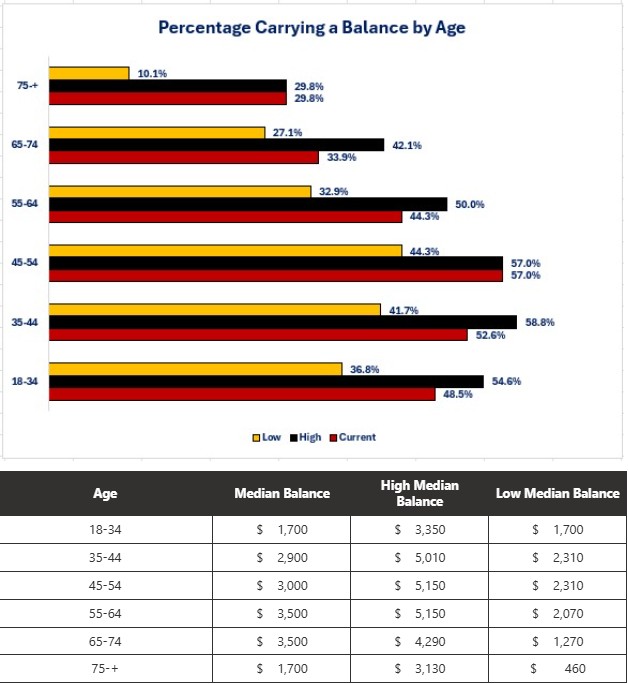
Now let us examine outstanding balance by age. Using this view reveals that two age brackets were at their highest percentage of credit card holders carrying outstanding balances since 1989.
-
45-54 years old = 57.0%
-
75 and older = 29.8%
The 45-54 year age bracket also had the highest percentage of credit card holders carrying outstanding balances of all age brackets. Even though the 45-54 year age bracket has the highest percentage of credit card holders carrying outstanding balance, the 55-74 year age brackets had the highest median outstanding balance ($3,500). The youngest (18-34) and oldest (75+) had the lowest ($1,700).
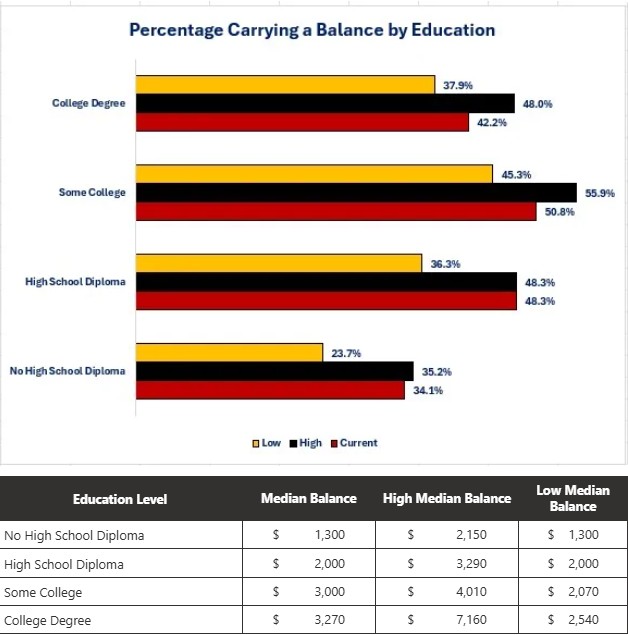
When examined by education level, people with a high school diploma experienced their highest percentage since 1989 as of 12/31/22 (48.3%) but people with some college education have the highest percentage for all levels of education (50.8%). Similar to the results when sorted by income level where the higher the income level the higher the median outstanding balance, the results when sorted by education show that the median outstanding balance rises as degree of education rises. Cardholders with a college degree and carried an outstanding balance had the highest median outstanding balance as of 12/31/22 ($3,270) and those with no high school diploma had the lowest median outstanding balance ($1,300).
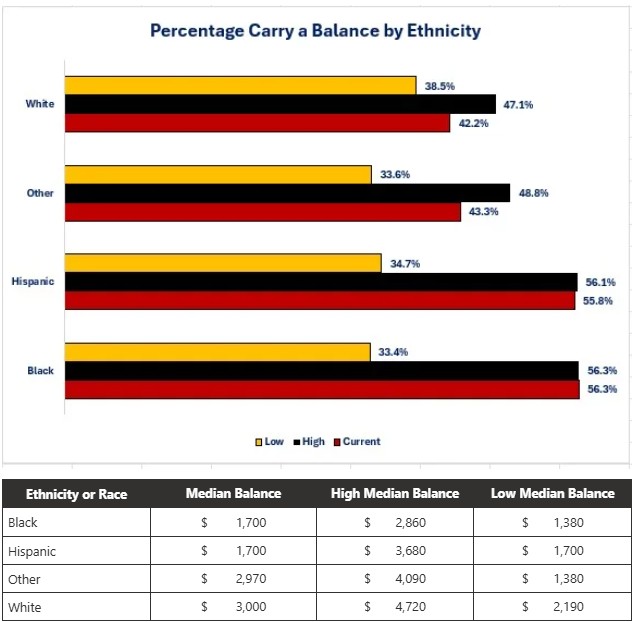
Finally, when examining outstanding balances by ethnicity, the results show that Black card holders have both the highest percentage for all groups and are at their highest percentage level since 1989. Hispanics are a close second while whites had the lowest percentage. Even though whites had the lowest percentage of card holders carrying an outstanding balance, whites had the highest median outstanding balance ($3,000) and Black and Hispanic cardholders tied for the lowest at $1,700.
After examining the data, the question you may ask is "what kind of financial burden is credit card debt placing on families. The same report provides a breakdown of before-tax total annual income for all families. Using this information we can derive the monthly income (i.e., divide the annual income by 12) and then calculate the minimum monthly payment as of the end of each year of the survey in order to get a perspective on how much of the monthly income would be consumed with the credit card payment. The table below used the midpoint of the income bracket except for the high and the low. I used $15,000 for the $19,000 or less bracket and $100,000 for the $90,000+ bracket.
The table highlights the bifurcation when examining the percent of monthly income used to pay the minimum balance on a credit card. The lowest income bracket experiences the highest financial burden while the two middle income brackets have the lowest percentage.
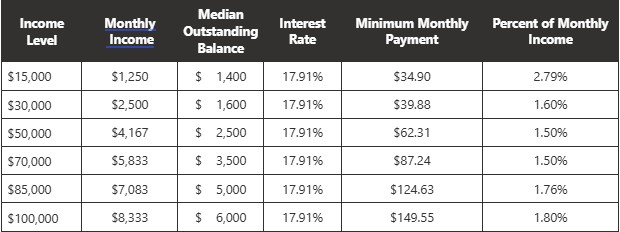
In examining this data, the percentage is less than 3% of the monthly income. For someone under financial stress, this may appear to be an attractive alternative for paying their bills. It may also be their only alternative. What gets missed is the cumulative effect of paying the minimum balance. The monthly payment may be a small percentage of the monthly income, but the amount of interest paid over time raises the cost of the item significantly. Using the lowest outstanding balance in the table above ($1,400) and the highest ($6,000) and assuming no change to the interest rate and no increases in the balance, it would take 5 years and 2 month to pay off the balance and the cumulative interest paid for the $1,400 would be $751.38. This means that the actual cost of the $1,400 purchase was $2,151.38. For the $6,000 outstanding balance the cumulative interest would be $3,219.34 giving a total purchase cost of $9,219.34. The problem becomes worse if someone uses more than one credit card and makes the minimum monthly payment for all the cards.
Currently, when viewed at the macro level, credit card payments do not appear to be a problem for the average household. As shown last week delinquencies and charge-offs peaked last year and are not showing a new rising trend. When viewed from the cumulative interest perspective the answer is less clear, especially for multiple card holders.
Ultimately, for those who do not pay off their balances each month, the risk occurs if the economy starts to deteriorate and their income becomes at risk whether through a lost job or reduced hours. The government may be able to continue to add on more debt to keep spending (for now) but, the consumer can only increase debt until they hit their credit limit.
The reality is that for the average household, once they max out their ability to use credit cards, then the bills become due immediately. This could cause a rapid slowdown in spending as money must be diverted from spending to paying bills or paying for purchases at the time of purchase. Credit card debt is one mechanism for spending that needs to be monitored for signs of distress since consumer spending continues to be the major contributor to economic growth.
Disclosures

Steve is the Economist for Washington Trust Bank and holds a Chartered Financial Analyst® designation with over 40 years of economic and financial markets experience.
Throughout the Pacific Northwest, Steve is a well-known speaker on the economic conditions and the world financial markets. He also actively participates on committees within the bank to help design strategies and policies related to bank-owned investments.