


Economic Summary
It was a busy week for economic data.
Both versions of consumer confidence/sentiment were released this week. The Conference Board's Consumer Confidence Index fell from 98.7 to 97.4 as consumers perception of labor markets deteriorated and fears over inflation rose. The University of Michigan released its Consumer Sentiment Index. The index also fell. The index fell to a 58.2 level from 61.7 in July. The Current Conditions sub-index fell to 61.7 from 68.0 while the Future Expectations sub-index fell to 55.9 from 57.7.
Data on the housing markets deteriorated in July. The Census Bureau reported a 0.6% decline in New Home Sales compared to a 4.2% increase in June. The West Coast was the only region that experienced growth. Weekly Mortgage Applications fell 0.5% after falling 1.4% the previous week. All of the decline was from applications to refinance. Applications to purchase a home rose 2.1% but applications to refinance fell 3.5%. The 30-year mortgage rate continued to be stable as the rate was 6.69% last week compared to 6.68% the week before.
There were multiple data releases on the manufacturing front this week. Durable Goods Orders fell 2.5% in July but it was all due to the volatile aircraft sector. Core Durable Goods Orders rose 1.1% for the month. The Dallas Federal Reserve Manufacturing Index fell to a negative 1.8 reading in August, down from positive 0.9 in July. The Kansas City Federal Reserve Manufacturing Index improved from a -3 reading in July to a 0 level in August. The Richmond Federal Reserve Manufacturing Index improved in August but remained negative. The index improved from a -20 reading in July to a -7 reading in August.
Data on layoffs remained encouraging as the Department of Labor reported a 5,000 decrease in Initial Jobless Claims last week while Continued Claims fell 7,000.
The Bureau of Economic Analysis (BEA) was busy with economic data releases this week. It released the results for the Personal Consumption Expenditure (PCE) Price Index for July. Year-over-year PCE rose 2.6% which was the same as June. The Core PCE Price Index rose 2.9% compared to 2.8% in June. The BEA also provided its first revision to 2nd Quarter Gross Domestic Product (GDP). It revised 2nd quarter's GDP from 3.0% to 3.3%. Personal and business spending had upward revisions to growth while government spending had downward revisions. It also reported a 5.0% year-over-year growth in Personal Income. This was faster than the 4.7% pace in June. Real Disposable Personal Income rose 2.0% in July compared to 1.7% in June. Personal Spending rose 4.7% compared to 4.8% in June. Real Personal Spending slowed from a 2.2% year-over-year rate in June to 2.1% in July.
Perspectives
Since the July employment report and the significantly slower growth of jobs that was reported, the jobs market has become the focus of attention for the media, analysts, politicians, and the Federal Reserve. The debate over whether the Federal Reserve should lower interest rates has centered around argument that slowing jobs growth could accelerate if the Federal Reserve does not lower interest rates. During his speech last week, Chairman Powell also cited the risk of further slowing in jobs growth as a reason for considering a rate reduction at the Federal Reserve's September meeting.
This week's Perspectives section is re-visiting employment indicators that are reported weekly and provide a close to real-time view of the jobs market; specifically-layoffs. The first is the initial jobless claims report. If companies begin to increase layoffs, it should show up in the initial claims data as this report shows the number of people of have lost their job and are making their initial claim for unemployment benefits. The second is the continued jobless claims report. This report shows the number of people who are continuing to file for unemployment benefits because they remain laid off and are unable to find a job yet. This is important for understanding potential impacts to economic growth. If people who have been laid off and cannot quickly find a new job, their income is impacted since unemployment benefits are less than the actual salary that was previously being earned. All else being equal, reduced income risks reduced spending which would slow economic growth.
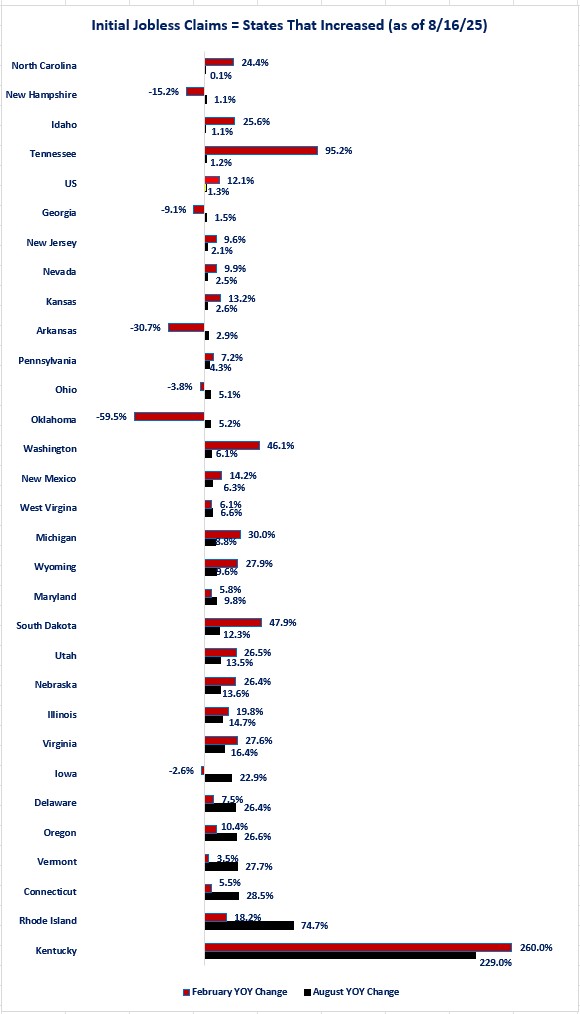
Let us start by examining initial claims. This will give us a picture of layoffs that are occurring. At a national level, the data shows that US initial claims have barely changed from last August's levels as the year-over-year change was 1.3%. This was also a solid improvement compared to the picture in February. At that time, the year-over-year change from February 2024 was 12.1%. At the state level there is a similar story of improvement. When examining year-over-year changes in initial claims as of 2/15/25, there were 76% of the states (38) that experienced an increase in initial claims compared to 2/17/24. Approximately 6 months later (8/16/25) that number has been reduced to 60% (30 states). From a macro perspective, this indicates improvement in the unemployment picture.
From a micro perspective, the first graph shows the 30 states that experienced an increase in year-over-year growth in initial claims as of 8/16/25, represented by the black bars. It also shows the year-over-year growth rates as of 2/15/25 represented by the red bars. What can be seen is that 17 states showed improvement from the year-over-year growth levels that existed in February while 13 showed deterioration. You can also see that of the 13 states that experienced deterioration, 6 of the states went from a decline in year-over-year growth in February to an increase as of August.
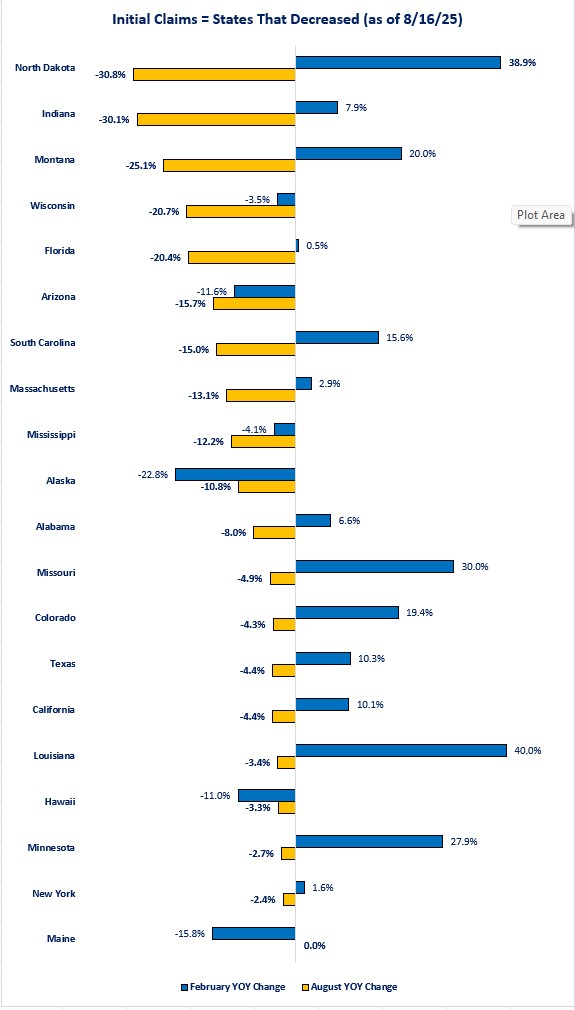
Examining the second graph reveals there are 19 states that experienced a year-over-year decline in initial claims as of 8/16/25 compared to 8/17/24 and 1 state that was unchanged (Maine). Gold bars are 8/16/25 while blue bars are 2/15/25. This was a solid improvement from February when only 6 of the 19 states had a decline in the year-over-year growth as of February. Only Alaska and Maine showed deterioration as of 8/16/25. Alaska's negative growth shrank, and Main went from negative growth to unchanged.
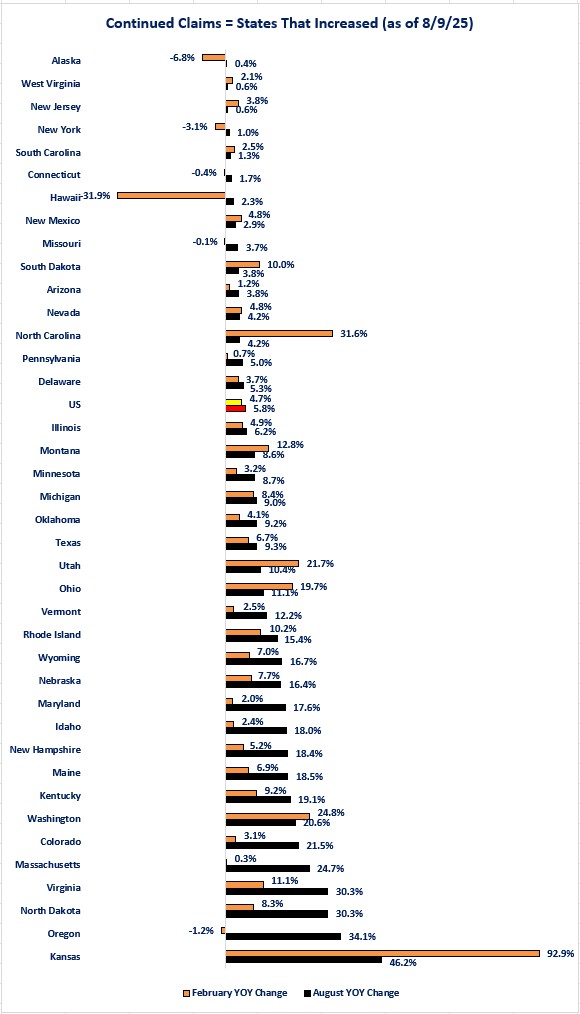
Now let us examine what is happening with continued claims. As discussed above, continued claims give us insight into people remaining unemployed and continuing to file for unemployment benefits. As of 2/8/25 there were 78% of the states (39) that experienced higher levels of continuing claims compared to 2/10/24. Now, as of the most recent data (8/9/25), there are still 39 states that are experiencing higher levels of continued claims compared to 8/10/24. For those curious, continued claims are reported one week later than initial claims. From a macro perspective, there has been no improvement in the number of states experiencing higher levels of continuing claims compared to a year ago.
From a micro perspective, even though the number of states has not changed, beneath the surface things have changed. The first graph below shows that of the 39 states that have experienced an increase in the year-over-year growth of continued claims as of 8/9/25. Black bars are 8/9/25 while orange bars are 2/8/25. of the 39 states, 31 experienced deteriorations as the year-over-year growth rate are higher in August compared to February. Drilling down a little further, 6 of the 16 flipped from a year-over-year decline as of February to an increase as of August.
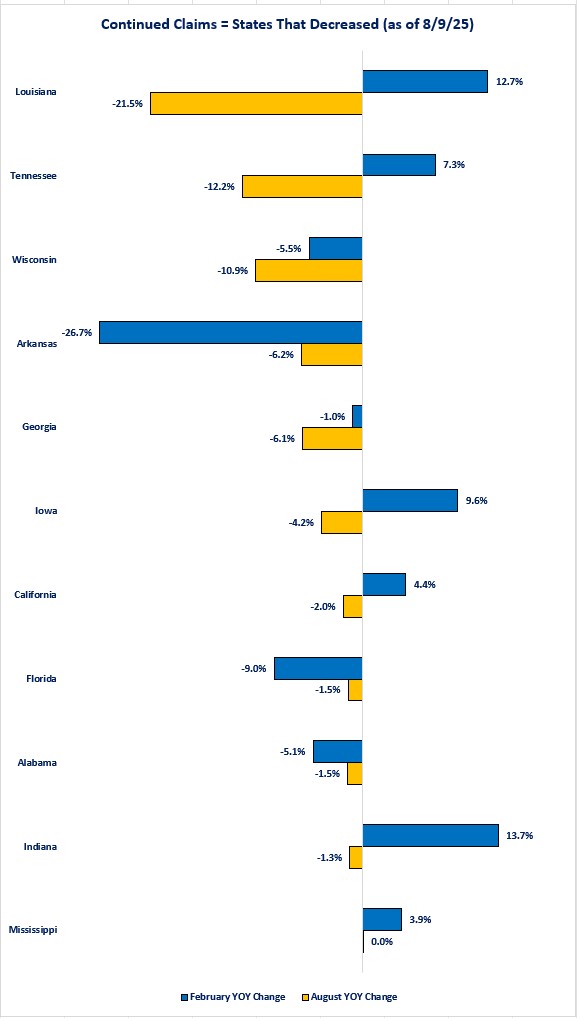
Examining the last graph, where gold bars represent 8/9/25 results and blue bars represent 2/8/25 you can see that of the 11 states that experienced a year-over-year decline or no change in continued claims, 6 flipped from a year-over-year increase in claims as of February to declines in August. Digging further reveals that 3 of the states experienced deteriorations as their rate of decline in August was less than February.
The data clearly shows that compared to a year ago, more states are experiencing growing levels of initial and continued claims as 60% of the states have higher levels of initial claims compared to a year ago and 78% of states have higher levels of continued claims. With regards to whether the situation is getting worse, the answer in no for initial claims since the percentage of states with higher year-over-year levels of initial claims has fallen from 76% in February to 60% in August. Continued claims have become worse, but they have not improved either.
The data is another example of the type of bifurcation that is happening within the national economy. Continued claims also highlight the bifurcation. The data highlights that if you lose your job, it may take longer to find a new one. This also could help explain the challenges that new entrants to the labor market are facing as they face competition from currently unemployed workers seeking a job.
Disclosures
The data comes from the Department of Labor weekly Unemployment Insurance Weekly Claims report.
- The analysis examined the year-over-year change in initial claims and continued claims and compared that to what the year-over-year change was six months ago.
-
Year-over-year change is being used because the state level data is not seasonally adjusted. That creates the risk that comparing month-over-month changes could be distorted by seasonal factors. Comparing year-over-year data should eliminate or reduce the seasonal influence.
-
To be consistent, even though the Department of Labor reports both initial and continued claims on a seasonally adjusted basis for its news release, the non-seasonally adjusted data was used so that it is comparable to the state data.
-
To keep the graphs readable, two graphs were used for initial and continued claims: one that shows states that experienced current year-over-year change increases and one for states that experienced decreases in the current year-over-year change.

Steve is the Economist for Washington Trust Bank and holds a Chartered Financial Analyst® designation with over 40 years of economic and financial markets experience.
Throughout the Pacific Northwest, Steve is a well-known speaker on the economic conditions and the world financial markets. He also actively participates on committees within the bank to help design strategies and policies related to bank-owned investments.