


Economic Summary
It was a busy week for economic data. What we learned was:
Construction
Construction spending continued to fall as it declined 0.1% in July. All of the decline was in private construction as public construction showed growth.
Housing
Homebuying activity continued to slow as weekly mortgage applications fell 1.2%, driven by a 5.1% decline in purchase activity. Refinancing activity was unchanged, and the 30-year mortgage rate declined slightly to 6.64%.
Jobs
Companies are reducing their job openings as the Bureau of Labor Statistics (BLS) reported a 176,000 decline in job openings as of 7/31/25. Some of that was during a 41,000 increase in hiring, but the rest appeared to be eliminations of job openings either through attrition or efficiency improvements. As it relates to the number of new jobs being added, ADP reported a 54,000 increase in its nonfarm payroll data while the BLS reported a 22,000 increase.
Manufacturing Sector
Manufacturing showed a slight improvement in activity as S&P-global reported an increase in its manufacturing PMI index from 49.8 to 53.0 in August. ISM also reported an increase in its manufacturing index as the index rose from 48.0 to 48.7. Growth in factory orders remained negative but improved from June's contraction. Orders fell 1.3% in July compared to -4.8% in June.
Services Sector
There were mixed results in the services sector as the S&P-Global Services PMI fell from 55.7 to 54.5 while the ISM version rose from 52.6 to 55.0.
Wages
Employees experienced solid increases in year-over-year wage growth as the BLS reported a 3.7% increase in average hourly earnings and a 4.1% increase in average monthly wages.
Unemployment
Initial jobless claims rose last week but remained in the 200,000 to 250,000 range. Initial claims rose 8,000 to 237,000. Continued claims showed improvement as continued claims fell 4,000. The BLS reported an increase in the nation's unemployment rate in August. The unemployment rate rose from 4.2% to 4.3%.
Perspectives
Last week the Bureau of Economic Analysis (BEA) released data for personal income and personal spending as of 7/31/25. This week's Perspectives compares changes in the sources of income and spending as of 7/31/25 and the past three and ten years. The five-year period was not examined since it was distorted by the pandemic crisis and the fiscal stimulus programs that went with it.
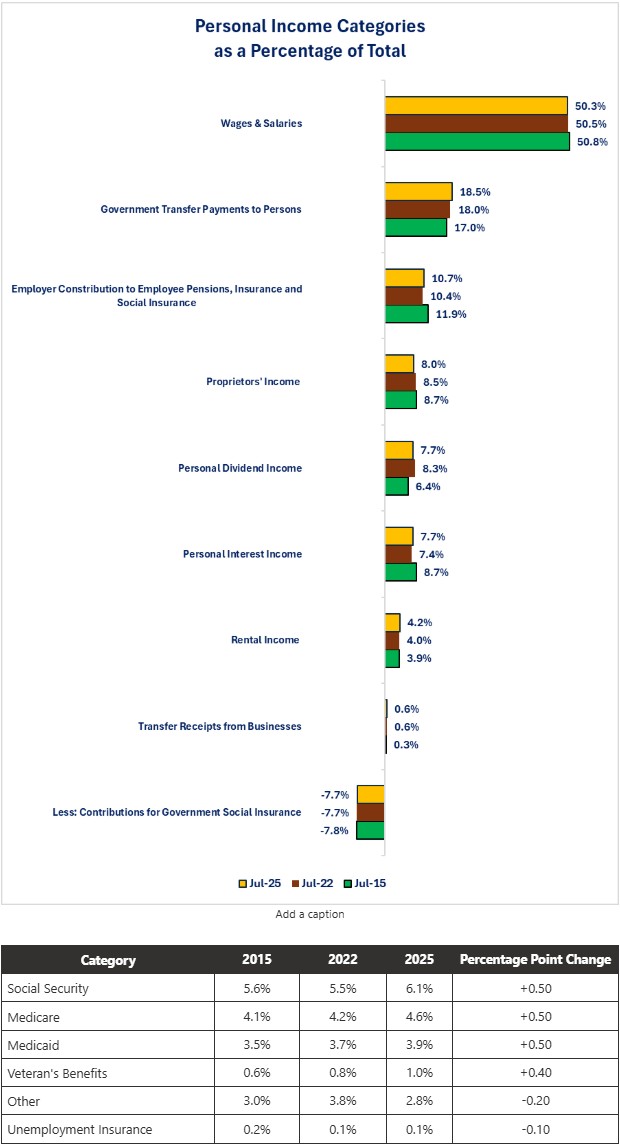
Let us start by examining the sources of income ranked by their percentage contribution to total personal income. It probably comes as no surprise that Wages & Salaries make up the largest percentage of total personal income as shown on the graph below. What may come as a surprise is that the biggest percentage change over the past ten years has been the increase in the percentage that Government Transfer Payments make up for total personal income compared to ten years ago. Wages & Salaries have steadily decreased as a percentage of total personal income while Government Transfer Payments have steadily risen. The BEA does not provide details behind the changes, but my educated guess would be that as the Baby Boomers are retiring, their higher salaries (relative to new entrants) are dropping out and they are now accessing Social Security and Medicare. If the retirement of Baby Boomers is the reason for the decline in the percentage contribution of Wages & Salaries, then it is also logical that the percentage contribution from Employer Contributions to Employee Pensions, Insurance and Social Insurance would also decline. The table below highlights the changes in the Government Transfer categories. You can see the increase in Social Security, Medicare, and Medicaid.
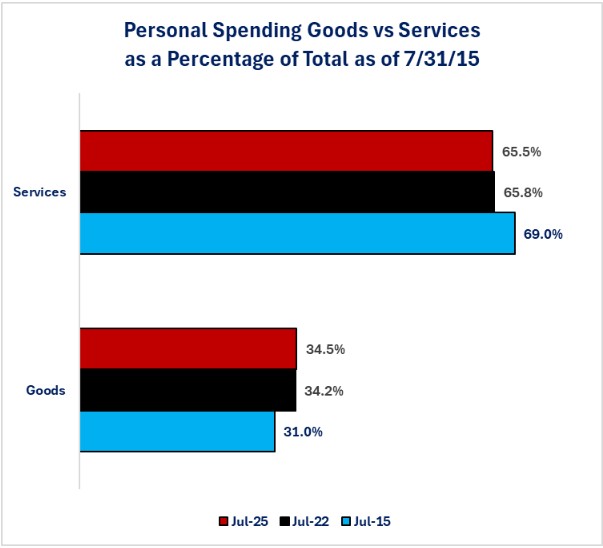
Now that we have a better understanding of the sources of income for individuals, let us examine how that income is being spent. If we start at the macro level, we can see that there has been a shift between purchases of goods versus services. Goods have increased from 31.0% of total purchases in 2015 to 34.5% in 2025. Services have declined from 69.0% to 65.5%. We know that during the pandemic crisis lockdown, purchases of goods surged and then started to reverse once the economy reopened. The graph below shows that the shift to goods versus services has not returned to the 2015 percentages. In fact, goods purchases continue to garner a higher percentage of total spending compared to 2015 when examining 2022 and 2025.
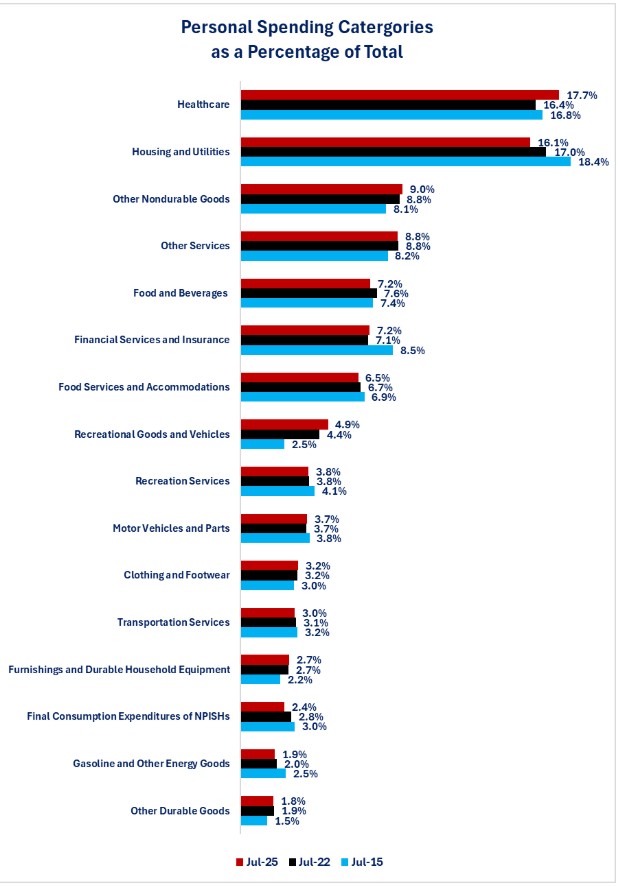
The last graph examines purchases at the micro level. The interesting story is that Healthcare now makes up the largest percentage of total spending. The Housing & Utilities category was the largest percentage in 2015 and 2024. Even though housing expenses have received a lot of media attention, healthcare costs are where the biggest shift has occurred.
The above graphs provide information about personal income and spending in total. It does not help us understand who is receiving the income and spending. By examining income distribution data from the BEA as well as spending distribution from the Bureau of Labor Statistics (BLS) we can drill down for more detail. Although the data is not as current (2023), the information is still insightful. You can see from the table below that both income and spending are concentrated at the upper 40% of the income brackets. The top 40% account for over 70% of personal income and over 50% of personal spending.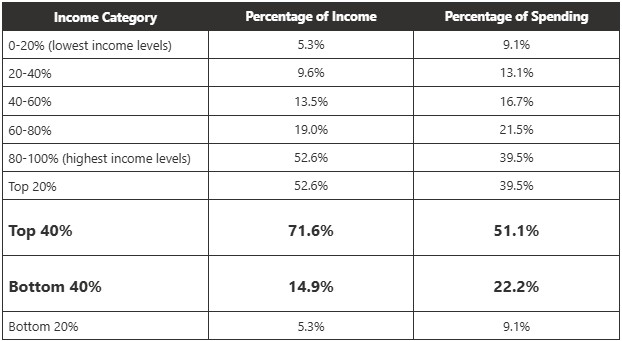
Given the rise in the percentage that government transfer payments make up in overall income levels, any changes that reduce those transfer payments put the economy at risk. This is especially true for Social Security and Medicare. Retirees that use that stream of income to fund purchases can be from all income levels not just the lower income levels. Upper income levels may not have the same level of reliance on Social Security and Medicare as the lower income levels, but they still may use those income sources for part of their discretionary spending to save more of their other sources of income for investing or for their heirs or charitable organizations.
With the upper 40% of income earners accounting for 51.1% of spending, there is concentration risk. If anything happens to the income stream for upper income households and reductions in spending occur, this could be the “straw that breaks the camel's back” event that pushes the economy into a recession. Of course, the opposite is also true. Events that boost or sustain income source for the upper 40% will be the fuel that keeps the economy growing.
Even though the upper income levels accounted for over 50% of spending, we cannot forget the lower income levels. The bottom 40% of income levels still account for over 20% of spending. Reductions or increases in spending for lower income levels will still have an impact on the economy as was evidenced during pandemic crisis when the lower income households received and spent the stimulus checks.
Understanding the personal income and spending data gives a better perspective on areas to watch for potential risk to the economy. With consumer spending accounting for close to 70% of US economic growth, anything that impacts consumer income (positive or negative) will affect spending and economic growth.
Disclosures

Steve is the Economist for Washington Trust Bank and holds a Chartered Financial Analyst® designation with over 40 years of economic and financial markets experience.
Throughout the Pacific Northwest, Steve is a well-known speaker on the economic conditions and the world financial markets. He also actively participates on committees within the bank to help design strategies and policies related to bank-owned investments.