


Economic Summary
After a busy week last week, the stream of economic data slowed this week. The key takeaways were:
Further signs of job market weakness were evident as Initial Jobless Claims rose above the 250,000 for the first time since 2021. Continued Jobless Claims were unchanged from the previous week.
Inflation is not going away as the Consumer Price Index rose from 2.7% to 2.9% year-over-year, and the Core Consumer Price Index remained at 3.1%.
The mortgage application market responded to the 30-year mortgage rate declining as both applications to purchase (up 6.6%) and applications to refinance (up 12.2%) contributed to MBA Mortgage Applications increasing 9.2% last week. The 30-year mortgage rate declined from 6.64% to 6.49%.
Businesses become more optimistic as the NFIB Small Business Optimism Index rose from 100.3 in July to 100.8 in August. Availability of qualified help remains the biggest challenge for small business owners.
Perspectives
With the recent decline in mortgage rates, discussion has started over whether housing will become more affordable for younger households and first-time home buyers. The primary focus most people have when discussing housing affordability is the mortgage payment. In reality, the focus needs to be on total housing payments. By that, I mean the total payments you must make to own a house. This would be the sum of the mortgage payment, property tax payment and homeowner's insurance. For some it also includes mortgage insurance and HOA expenses.
This week's Perspectives section examines housing affordability by examining how much of total personal income is consumed by total housing payments by state. To keep things comparable, I converted the monthly mortgage payment to an annual mortgage payment to match how the property tax and homeowner's insurance are reported.
Soundbite
-
Only 26% of states in the US have a total housing expense/total personal income percentage below 30%.
-
That means it would take two income earners to qualify for a mortgage in 74% of the states.
-
Relying on two incomes puts a household at risk if something happens to one of the incomes.
Analysis
For most mortgage lenders, the general rule is that your PITI (Principal, interest, taxes, and insurance) cannot exceed 28% to 30% of your personal income (PI). For most households, the desire is to qualify for a mortgage with one income to allow the other income to cover the other major expenses (i.e., student loan payments, daycare, saving for kids' college, saving for retirement, etc.).
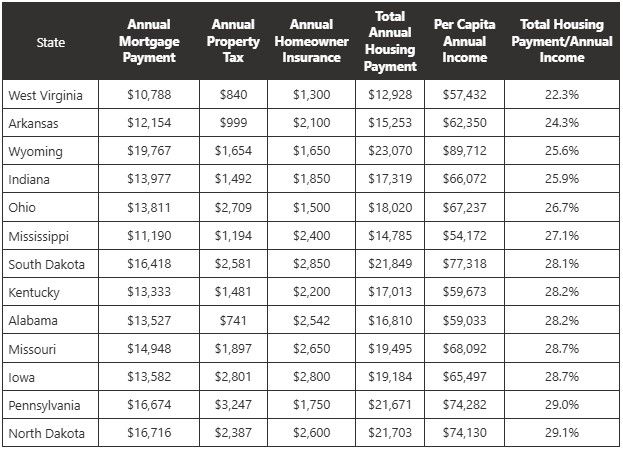
The first graph shows the states where the PITI/PI percentage is below 30%. As you can see, only 13 states have a PITI/PI ratio below 30%. That is 26% of the states where a household could qualify for a mortgage with just one income. The table below the graph gives the breakout of PITI and PI. The information at the bottom of this article identifies the sources for this data.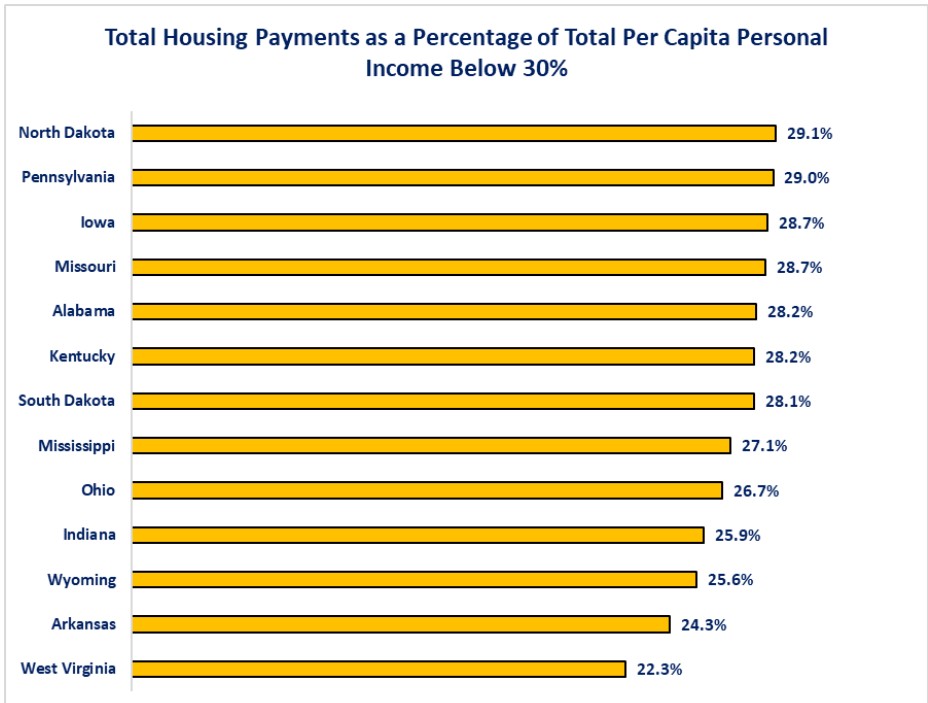
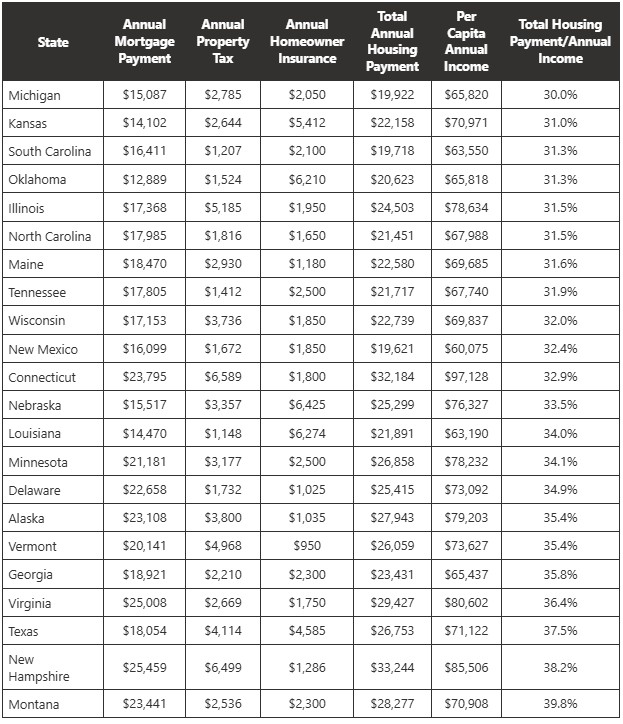
The second graph and table show that 22 states (44%) have a PITI/PI ratio between 30% to 39.9%. For these states, two incomes are needed to qualify for a mortgage, but it is potentially not putting a big strain on their income and income remaining for the other expenses. Of course, that assumes that each person is earning the same amount of income. Those households who have one income earner earning more than the per capital average for the state and one making the average are in better shape than a household where one earns the per capital average and one earns less.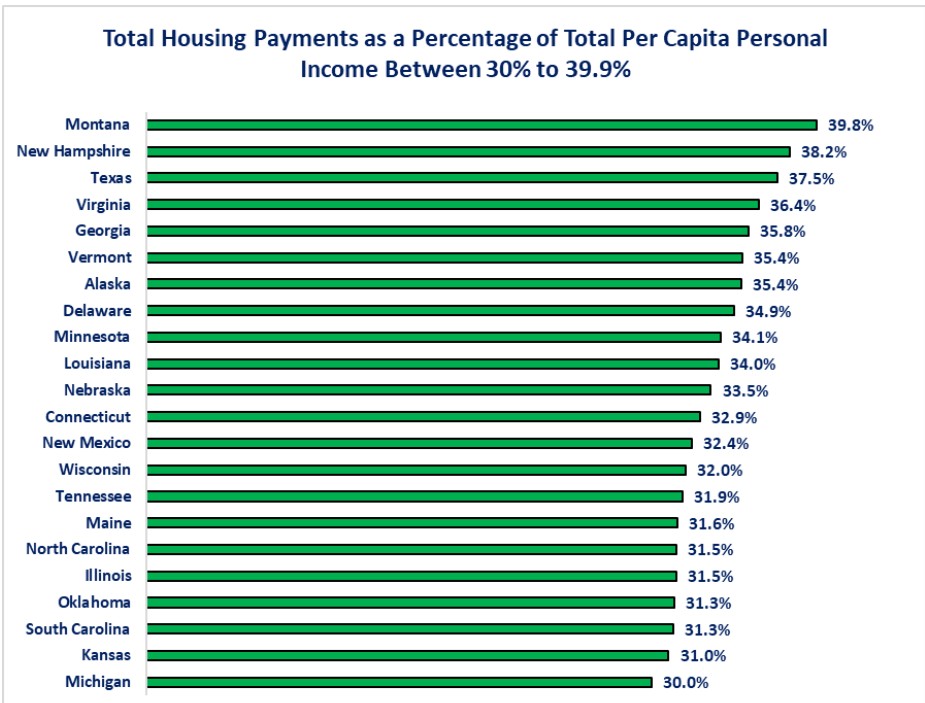
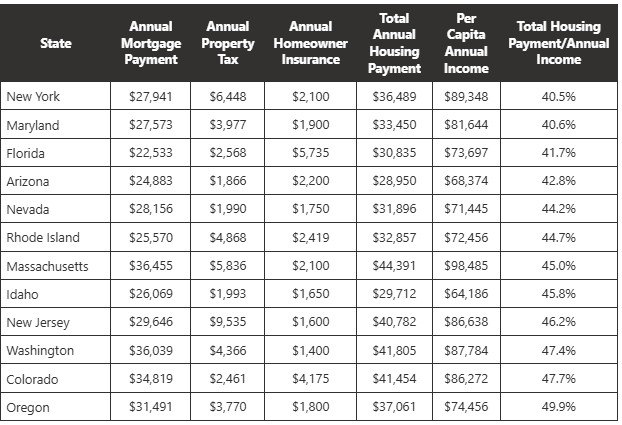
The next graph and table identify 12 states where the PITI/PI percentage is between 40-50%. These households will be more vulnerable to anything that lowers the income for the household. Unfortunately, for the three states where Washington Trust Bank has offices, they all fall into this PITI/PI percentage group with Oregon the highest of this group, Washington the third highest and, Idaho the fifth highest.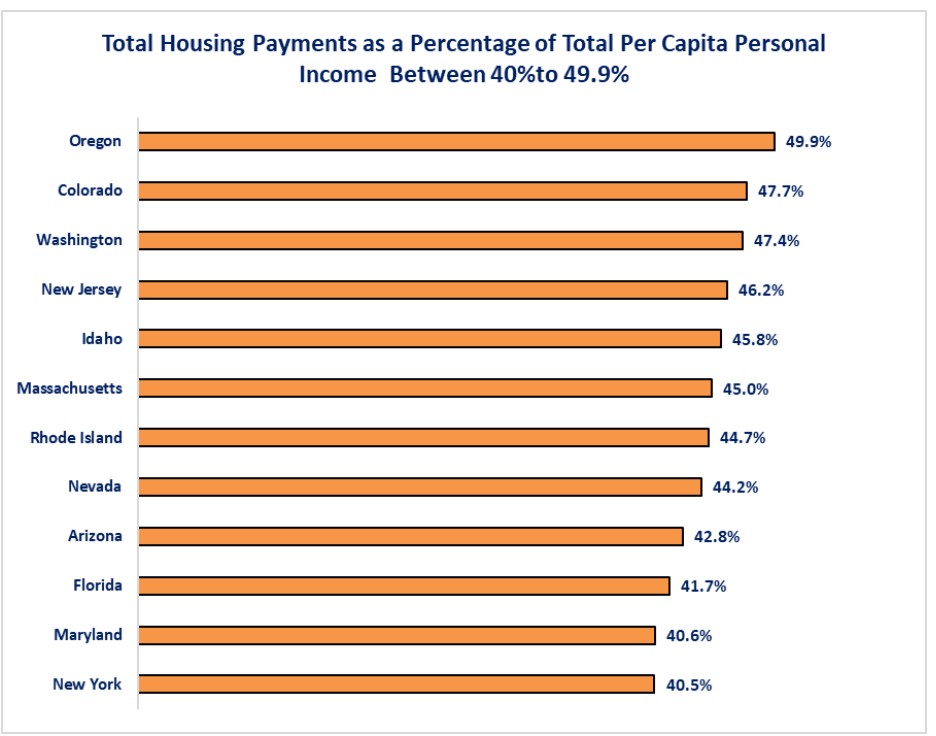
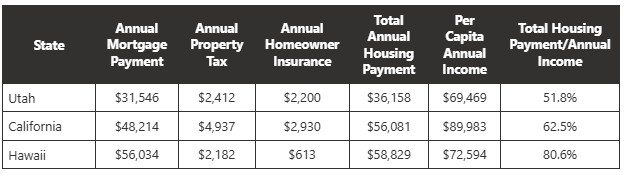
The last graph and table identify the three states with a PITI/PI percentage above 50%. It is probably an understatement to say that homeownership is a challenge for young households desiring to own a home in these states.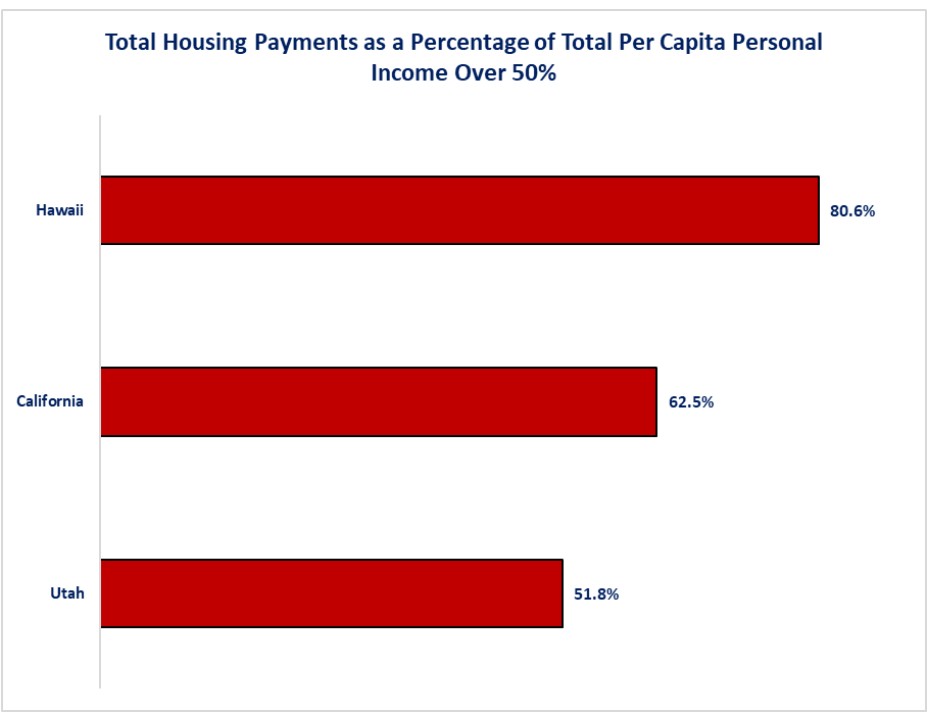
This analysis examines the traditional PITI/PI methodology. A second method that some mortgage lenders will use is a total debt/total income percentage. Using that method the range to qualify is 45% to 50%. For a young household that has not incurred other debt, this is a potential route toward home ownership using one income. The problem is that, even though this allows them to qualify, it does not change the reality that they are committing 45-50% of their income toward their house if they want to rely on one income earner for the housing payments. The reality for many is that they may still rely on two income earners even though they qualify using one income earner.
The challenge for homeowners with high PITI/PI or Total Debt/PI ratio is that some of the components of that debt are not fixed. Over the past five years, many households who thought that a fixed rate mortgage would lock in their housing expenses have now found out that the property tax and homeowners insurance are rising. There are currently four states where property tax plus homeowners' insurance is over 50% of the principal and interest payments of the mortgage. Ther are fourteen states where the property tax plus homeowners' insurance is more than 30% but less than 50% of the principal and interest payments.
What the data does not show is the bifurcation that we saw from last week’s analysis of personal income and spending. Per capita personal income is the total personal income in a state divided by resident population of the state. That process evenly distributes the personal income. Last week’s Perspectives showed us that the top 40% of income earners have 71.6% of the income. Even though we do not have specific data breaking down personal income by job or age, the implication is that 60% of the income earners have personal income lower than the per capita numbers would indicate. That makes qualifying for mortgage more difficult.
Housing affordability remains an issue without a clear solution in sight yet. Lower home prices are one solution, but increasing the supply of homes is hampered by the high cost of materials and labor to build a house. Deportations and tariffs are compounding that problem. Lower interest rates are another way to make housing more affordable. Unfortunately, many may be disappointed if the Federal Reserve lowers short-term interest rates, but long-term interest rates do not decline. This may be true for fixed rate mortgages since their rate is tied to long-term rates. Long term rates are driven by expectations for inflation and the amount of US Treasury debt being issued. Neither of these two factors are currently declining. Without these factors declining, the reality is that a recession may have to be the force that drives long-term rates significantly lower. None of us are cheering for that to be the solution.
Disclosures
-
Median home selling price by state comes from Redfin.
-
Mortgage payment assumes a 10% down payment and a 30-year fixed rate mortgage.
-
-
Annual property tax by state comes from Wallet Hub.
-
Annual homeowner's insurance by state comes from Insurance.com.
-
Per capita personal income by state comes from the Bureau of Economic Analysis.

Steve is the Economist for Washington Trust Bank and holds a Chartered Financial Analyst® designation with over 40 years of economic and financial markets experience.
Throughout the Pacific Northwest, Steve is a well-known speaker on the economic conditions and the world financial markets. He also actively participates on committees within the bank to help design strategies and policies related to bank-owned investments.