


Economic Summary
The economic calendar is busy this week. What we learned:
Housing
Construction of new homes fell in August as Housing Starts declined 8.5%. Future activity does not look encouraging as Building Permits fell 3.7%. The picture was different for home buying activity. Mortgage Applications surged 29.7% last week as the recent decline in mortgage rates triggered a refinancing wave. Refinancing applications rose 58% compared to the week before while applications to purchase a house rose 3%. The 30-year fixed rate mortgage rate fell to 6.39% last week compared to 6.49% the week before.
Inflation
Consumers and businesses got a break from rising prices as Import Prices were unchanged in August compared to July. For US exporters, they benefited from a 3.4% increase in Export Prices.
Jobs
Initial claims fell 31,000 last week which reversed the increase from the week before. Continued claims fell 7,000.
Leading Index
The Conference Board reported a 0.5% drop in its Leading Index in August after a 0.1% rise in July.
Manufacturing
Manufacturing data gave a mixed message this week. Manufacturing activity in the New York Federal Reserve region fell into negative territory as the Empire State Manufacturing Index fell from +11.9 in August to -8.7 in September. The Philadelphia Federal Reserve Manufacturing Index showed opposite results compared to the NY results as the index rose from -0.3 in August to +23.2 in September.
Retail Sales
Despite all the worries about jobs growth, consumers keep spending. Retail Sales rose 5.0% year-over-year with online sales driving robust growth. Online sales rose 10.7%.
Perspectives
There has been plenty of debate this year over the Federal Reserve's interest rate decision making process. With the Federal Reserve lowering its overnight borrowing rate by 0.25% on Wednesday, I thought this would be a suitable time to examine the Federal Reserve's mandate and economic data points it considers when making interest rate decisions.
Soundbite
Examining economic data related to the Federal Reserve's mandates indicates the Stable Inflation mandate had not been met, the Full Employment mandate data gives mixed signals and the Moderate Long-Term Interest Rate mandate leaves plenty of room for debate as to whether the mandate has been met. Economic data is one of the tools used to make interest rate decisions, but the final decision still comes down to the analysis, experience, and judgement of humans, i.e., Federal Reserve officials. Even though the Federal Reserve lowered its overnight borrowing rate this week, it communicated that it does not mean it is now on a path of steady reductions in its overnight borrowing rate. Chairman Powell was clear that decisions on the rate will be a meeting-by-meeting process based on what has happened with economic data.
Analysis
The Federal Reserve was created by Congress under the Federal Reserve Act. Within that legislation were the mandates given to the Federal Reserve. The common theme you may hear about is that the Federal Reserve has two mandates:
-
Stable Inflation
-
Full Employment
It may surprise you to learn that the Federal Reserve has three mandates:
-
Stable Inflation
-
Full Employment
-
Moderate Long-Term Interest Rates.
For many people this third mandate may come as a surprise because it was not actively discussed until the new Federal Reserve governor-Stephen Miran-raised it during his confirmation hearings.
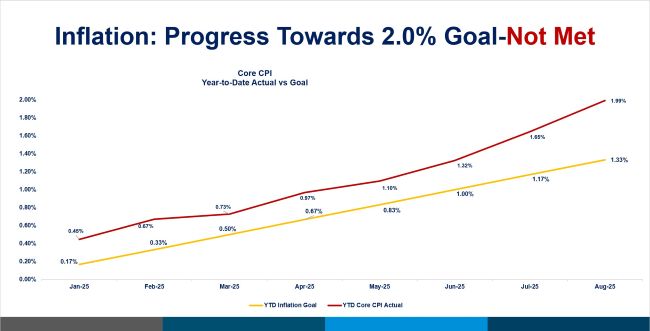
Let us start by examining the Stable Inflation mandate. The Federal Reserve monitors two inflation indices when considering whether this mandate has been met. It focuses on the Consumer Price Index (CPI) and the Personal Consumption Expenditures Price Index (PCE). When examining these indices, it focuses on the “core” numbers which exclude food and energy. The Federal Reserve's logic for focusing on the core number is its belief, whether true or not, that monetary policy cannot directly influence the food and energy sectors. The first two graphs illustrate year-to-date progress toward meeting the Federal Reserve's 2.0% target. As you can see, neither index is close to where it should be to hit the 2.0% target by year end. In fact, the core CPI index is basically at 2.0% with four months of data left to report. The August data for the core PCE index will not be released until later this month but you can see that, through July, it is also not close to the year-to-date target level. The direction for both indices is also moving in the wrong direction.
If the Federal Reserve were strictly looking at the inflation data, it would not have been inclined to lower its overnight borrowing rate (Fed Funds) this week. This mandate was the priority focus from the 1st quarter of 2022 until the 4th quarter of 2024. Thus, the reason for raising interest rates during this period.

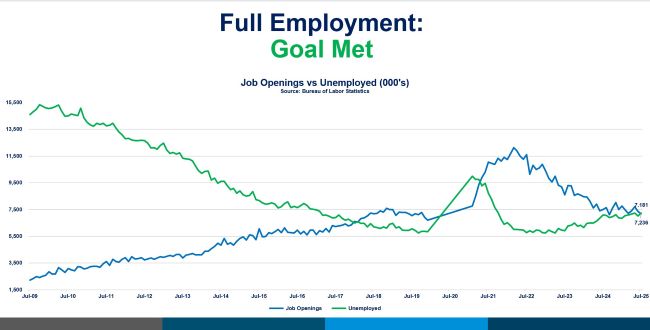
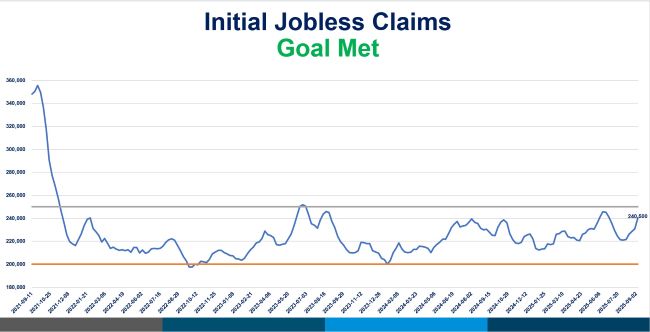
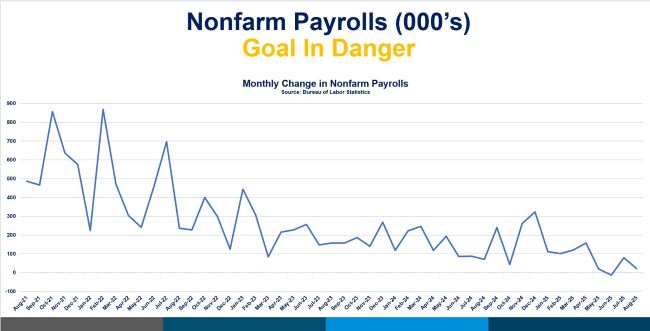
Now, let us examine the second mandate: Full Employment. There are several economic data series that help evaluate whether the labor market is at full employment. The first one is job openings versus unemployed people. Federal Reserve officials have indicated that the labor market is in balance (i.e., full employment) when the number of job openings equals the number of unemployed people. As you can see from the first graph blow, we are essentially at that level as of the most recent data. The next graph shows initial jobless claims. If the labor market was in trouble, jobless claims should be rising as companies lay off employees and those employees file for unemployment benefits. As you can see from the graph, jobless claims have been volatile, but they remain in the range between 200,000 to 250,000. This data series would indicate that the labor market is stable and imply that it is at or close to full employment. The last graph illustrates monthly growth in nonfarm payrolls (i.e., jobs). This data clearly shows a steadily slowing pace of jobs growth and would indicate potential problems in the labor market.
Examining the three data series sets may lead some to believe that the full employment mandate is still being met and no interest rate reductions are necessary. Others may argue that the weakness in jobs growth is sufficient to warrant an interest rate reduction. It all depends on which data series you place the greatest emphasis.
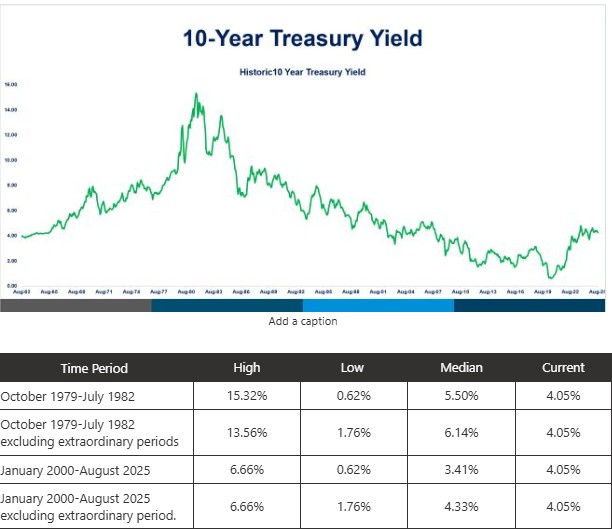
Finally, let us examine the 10-year Treasury to try to determine what a “moderate” yield would be. As you can see from the graph, the time frame matters. The Federal Reserve Act does not quantify what “moderate” is, so determining what is moderate is more of an art form than a quantitative exercise. Perhaps that explains why the Federal Reserve has not highlighted this mandate. Previous Federal Reserve officials indicated that the Federal Reserve's belief is that the Moderate Long-Term Interest Rate mandate would be an outcome of achieving the Stable Inflation and Full Employment mandates.
Conceptually, moderate would imply a rate that is in the middle of a range of rates for a given time. Using that logic, we can identify the median rate which is the middle and use that as our guide for determining moderate.
The table following the graph below shows that over an extended time frame (1962 to 2025) the median 10-year Treasury yield was 5.50%. By that measure, the current 10-year Treasury yield of 4.05% is below the median. This would indicate that the Moderate Long-Term Interest Rate is met. The problem with that time frame is that there were two “extraordinary” events during that time.
-
October 1979 to July 1982. During this time, the Federal Reserve took extraordinary action in raising interest rates sharply higher to bring the double-digit inflation problem under control.
-
November 2008-January 2021. During this time, the Federal Reserve took extraordinary action (Quantitative Easing) to suppress interest rates in an effort to stimulate the economy.
If we remove those two periods, the median yield on the 10-year Treasury rose from 5.50% to 6.14%. This would argue that the current 10-year Treasury yield is better than moderate.
An argument could be made that times have changed, and a long view is not realistic. To address that concern, let us limit our range to the turn of the century (2000-2025). Using this methodology, the median yield on the 10-year Treasury moves to a 3.41% yield. The current yield of 4.05% is then above the moderate level and an argument could be made that the yield needs to be lower by at least 0.50%. Once again, the problem with that time frame is that it was distorted by the Quantitative Easing interest rate suppression period. Using the same methodology as before and removing the Quantitative Easing rate suppression period, the median yield on the 10-year Treasury is 4.33%. Since the current yield of 4.05% is below 4.33%, that would indicate that the current rate is moderate or better. Three out of the four methods indicate the Federal Reserve has met it Moderate Long-Term Interest Rate mandate and no change to interest rates are needed.
Unfortunately, since the legislation does not define “moderate,” deciding if the Moderate Long-Term Interest Rate mandate has been met is left to subjective decision making. As discussed above, this makes the decision-making process for this mandate more of an art form.
Conclusions
-
During the press conference following the conclusion of its rate setting committee, Chairman Powell provided two insights into the committee's decision.
-
The decision to lower the overnight borrowing rate by 0.25% was a “risk management” decision. By that he meant that the Federal Reserve was acting proactively before a problem became obvious. Essentially it was like an insurance policy put in place in case the economy weakened from current levels.
-
The Federal Reserve is now giving priority to its Full Employment mandate, and it is also giving priority to the nonfarm payrolls data series to determine if the Full Employment mandate is being met.
-
-
Even though the Federal Reserve lowered its overnight borrowing rate this week, it communicated that does not mean it is now on a path of steady reductions in its overnight borrowing rate. Chairman Powell was clear that decisions on the rate will be a meeting-by-meeting process based on what has happened with economic data.
-
Economic data is one of the tools used to make interest rate decisions, but the final decision still comes down to the analysis, experience, and judgement of humans, i.e., Federal Reserve officials.
Disclosures
-
All data except for PCE came from the Bureau of Labor Statistics.
-
PCE data came from the Bureau of Economic Analysis.
-
The most recent data is August, except for the following.
-
Job Openings data is as of 7/31/25.
-
Unemployment data used 7/31/25 data to be consistent with Job Openings data.
-
PCE data is as of 7/31/25.
-

Steve is the Economist for Washington Trust Bank and holds a Chartered Financial Analyst® designation with over 40 years of economic and financial markets experience.
Throughout the Pacific Northwest, Steve is a well-known speaker on the economic conditions and the world financial markets. He also actively participates on committees within the bank to help design strategies and policies related to bank-owned investments.