


Economic Summary
It was an active week for economic data releases this week. In summary, what we learned was:
The economy grew faster in the 2nd quarter than what was originally reported but showed evidence of slowing in September; companies remain reluctant to lay off staff; new home sales surged in August but current activity was virtually unchanged; the second measure of inflation showed no change in August and consumer sentiment deteriorated further in September.
Economic Activity
-
The Bureau of Economic Analysis released the final results for 2nd quarter GDP. Economic growth was revised higher from a 3.3% annualized rate to 3.8%.
-
S&P-Global reported a decline in its Manufacturing PMI index from 53.0 in August to 52.0. The Richmond Federal Reserve reported a decline in its Manufacturing Activity Index from -7 in August to -17 in September.
-
S&P-Global reported a decline in its Service Sector PMI from 54.5 in August to 52.9 in September. The Richmond Federal Reserve reported a decline in its Service Sector Activity Index from 4 in Augst to 1 in September.
Jobless Claims
-
Initial Jobless Claims fell by 14,000 last week while Continued Claims fell by 2,000.
Housing Market
-
New home sales surged in August as new home sales rose 20.5% led by a 72.7% increase in the North region. Building permits fell 2.3%.
-
Housing activity was muted last week as mortgage applications rose 0.6%. Applications to buy a house were unchanged while applications to refinance rose 0.8%.
Inflation
-
The Bureau of Economic Analysis released data on its inflation index for August, and the good news was that the year-over-year growth in the PCE Index was the same as in July at 2.9%. That remains well above the Federal Reserve's target of 2.0%.
Sentiment
-
The “vibecession” lives on as consumer sentiment deteriorated further in September. Consumer sentiment fell from 55.4 in August to 55.1 in September. The Current Conditions sub-index fell from 61.2 to 60.4 while the Future Expectations Index fell from 51.8 to 51.7.
Perspectives
As discussed above, new home sales experienced a surge in sales in August. As I have advised in the past, it is important to understand the data behind the headlines and the monthly result for new home sales is a good example. As a result, this week's Perspectives section undertakes a deeper examination of new home market.
Soundbite
-
New home sales have gained importance since the traditional supply of existing homes has been inhibited by the fact that a decade's worth of home buyers have mortgage rates below 4% and are reluctant or unwilling to sell.
-
Even though housing affordability remains a problem for young first-time home buyers, new home sales are still occurring.
-
Beneath the surface of the national data on new home sales lies the fact that over half of the new home sales are occurring in the South region.
-
New home sales are another example of the bifurcation in the US economy. Median home prices in the Northeast are more than double the price in the South region.
Analysis
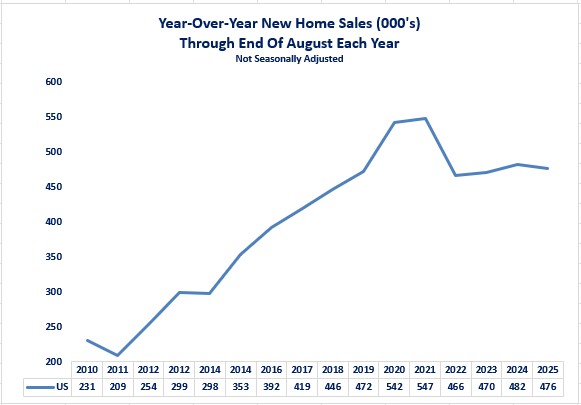
Even though the one-month data showed a 20.5% increase compared to July, the year-over-year results give us a longer-term view. Distortions may occur monthly while a year-over-year view helps smooth any monthly variability. Let us start by examining year-over-year new home sales as of the end of August for each year since 2010. What the first graph below illustrates is that, during the low-interest rate environment that existed between 2010 and 2020, new home sales steadily increased. Once inflation arrived and the Federal Reserve began raising interest rates, new home sales suffered a serious drop. Since 2022, the number of new homes sold has been relatively stable. One thing to remember is that a new home sold does not mean the home is ready to be occupied. As of 8/31/25, 50% of the new homes sold were completed, 38% were under construction and 12% where construction had not yet started.
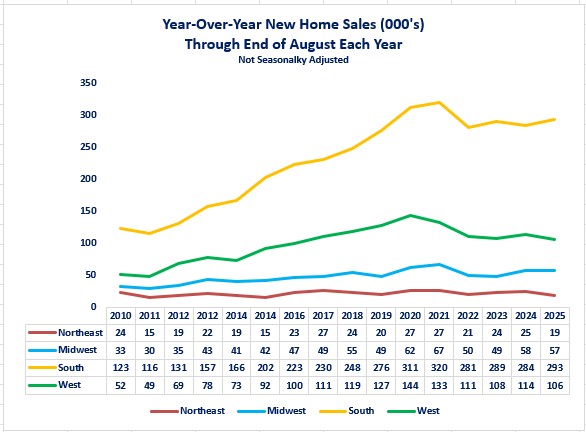
The second chart shows that the national numbers are heavily driven by sales in the South region. The South has accounted for over 50% of new home sales since 2010 and is more than double the number of new homes sold in the second biggest region (West). As you can also see from the second graph, the recent trend for the South is rising while all other regions show flat to declining trends.
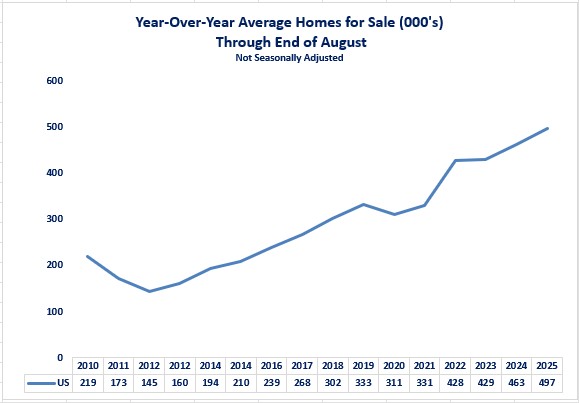
Now, let us examine whether home builders are keeping pace with new home sales and providing an inventory of new homes available for sale. As of August 2025, 53% of the new homes for sale are under construction, 25% are completed, and 22% where construction has not started yet.
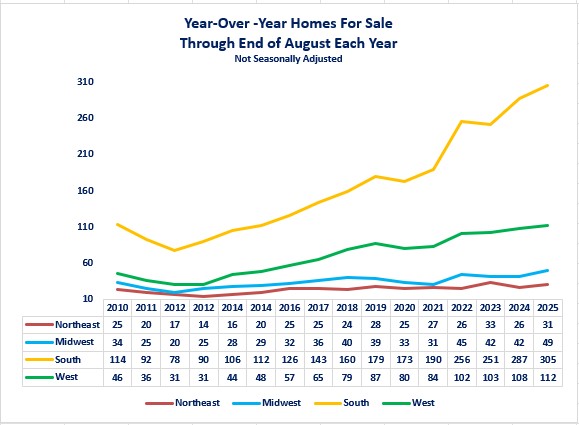
Once again, you can see from the second graph that new homes available for sale are dominated by the South region again. In this case, the difference between the South region and the West region is 2.7 times more than the West region. The current trend for all regions is a rising trend but, the South region shows a much faster rising trend.
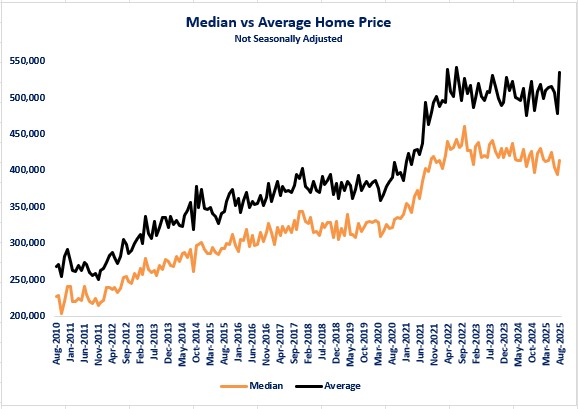
One of the biggest factors that affects new home sales is the price of homes. There are two ways to look at price trends: average home prices or median home prices. Average home prices can be affected by the type of homes being sold. Very high priced or low priced homes can affect the average new home price. The median home price shows the price that is in the middle of the total price range of new homes sold. As you can see from the graph below, the average home price has been stable with a recent spike up while the median home price has been trending slightly lower.
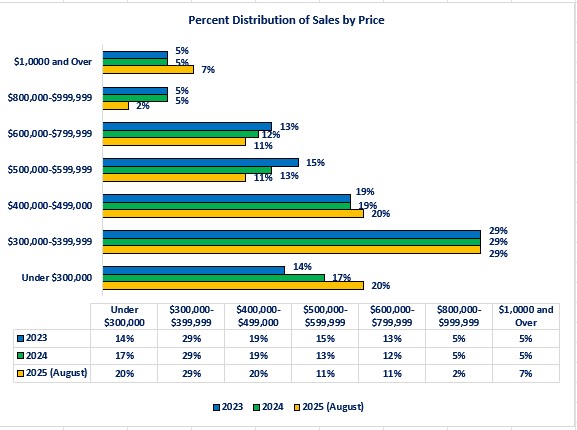
The following graph shows a comparison of homes sold by price over the last three years. With all discussion of housing affordability, it may surprise you to learn that 69% of new homes sold were sold at a price less than $500,000 and 20% were sold for less than $300,000. That can be explained by where new home sales are occurring-the South.
|
Region |
Median Home Price |
Average Home Price |
|---|---|---|
|
South |
$372,100 |
$446,300 |
|
Midwest |
$385,300 |
$448,500 |
|
West |
$531,100 |
$642,700 |
|
Northeast |
$796,700 |
$1,170,800 |
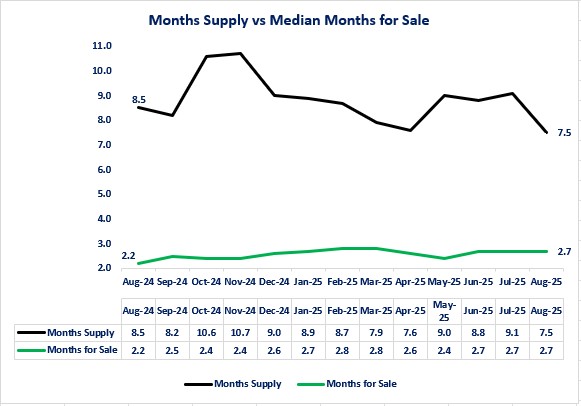
The last factors to examine to give us a full picture of the new home market are how many months of supply is available and how many months a new home is for sale before it is sold. The graph below illustrates that the months of supply of new homes available for sale is trending down. The peak was in the 4th quarter of 2024, and the current trend is declining. That is good for builders who do not want to carry inventory but not that good for buyers.
The time it takes to sell a new home has been stable over the past three months. It is still higher than a year ago (2.2 months vs 2.7 months), but the trend is not rising.
Conclusions
-
New home sales are only one half of the housing market, with existing home sales being the other half. The problem is that the existing home sales market is suffering from a glut of “zombie” homes. By that I mean that there is a decade of home buyers who benefited from the Federal Reserve's interest rate suppression policy between 2009 to 2019. These home buyers have interest rates on their mortgage that are below 4%. Traditionally the cycle of homes available for sale is that a family buys their first home, then sells that home and buys a bigger home as their family or income grows. As they age, they sell that home to downsize to a smaller home or move into a retirement community. This process created inventory for new home buyers to buy. With the low mortgage rate, many households have been unwilling to sell their home to buy another home because of the difference in interest rates. In many cases, they chose to remodel instead. This creates the “zombie” home that is locked down due to the interest rate differential. As the supply of existing homes stalled or declined, new home sales took on the role of providing new supply to the housing market.
-
Despite the affordability issue for many first-time home buyers, new home sales are still growing.
-
The problem is that the growth is concentrated in one area-the South region and is creating a growing bifurcation between regions. As of August 2020 the difference in new home sales between the strongest region (South) and weakest (Northeast) was 5.1 times. Now, as of August 2025 the factor is 15.4 times.
Disclosures
-
All data was from the Census Bureau except for the median and average home price by region.
-
The median and average home price by region was from HUD.

Steve is the Economist for Washington Trust Bank and holds a Chartered Financial Analyst® designation with over 40 years of economic and financial markets experience.
Throughout the Pacific Northwest, Steve is a well-known speaker on the economic conditions and the world financial markets. He also actively participates on committees within the bank to help design strategies and policies related to bank-owned investments.