


Economic Summary
It was a quiet week for economic data due to the partial government shutdown. What we did learn was that the consumer sharply cut back on taking on new debt, the housing market experienced continued slowing and consumers sentiment about their current situation improved but their outlook for the future deteriorated.
Consumer Credit
Consumer credit fell from $18.05 billion growth in July to $360 million growth in August.
Housing
The Mortgage Bankers Association reported a second week of declines in mortgage applications. Mortgage applications fell 4.7% this week with a 7.7% decline in refinancing applications leading the decline. Applications to purchase a house fell 1.2% while the 30-year mortgage rate was virtually unchanged at 6.43% compared to 6.46% the week before.
University of Michigan Consumer Sentiment
Consumer sentiment fell from 55.1 to 55.0. Sentiment over current conditions improved from 60.4 to 61.0. Consumers' outlook for the future declined from 51.7 to 51.2.
Perspectives
Given the current level of uncertainty over fiscal policy (i.e. tariffs, government shutdown, funding cuts, tax cuts and regulatory relief) debate continues over the state of the economy, I thought this would be a good time to revisit the economic data that the National Bureau of Economic Research (NBER) follows to determine when a recession starts and stops. Although the official determination of a recession lags the actual event, the data series gives us insight into what the NBER is monitoring.
Soundbite
Analysis
As a refresher, the NBER is the official organization that decides when recessions begin and end in the US. It defines a recession as a significant decline in economic activity that is spread across the economy and lasts more than a few months. Basically, it is saying that the decline in economic activity must be deep, occurring throughout the US and has been happening for more than a couple of months. Given that definition, it will never be proactive in calling the start of a recession in real-time. Instead, it is cautious and waits to confirm that the conditions are met. So, we cannot rely on the NBER to give us the warning signs of an approaching recession or to raise the red flag as soon as a recession starts. What it does provide us with is the economic data that it monitors. Monitoring that data should give us clues about whether a recession may be approaching. The economic data series are:
-
Employment
-
Nonfarm Payrolls
-
Real Personal Consumption Expenditures
-
Real Personal Income less Transfer Payments
-
Real Manufacturing and Trade Industries Sales
-
Industrial Production
What we do not know is how it specifically uses the data series to make its decision. The only guidance it provides is the following:
“There is no fixed rule about what measures contribute information to the process or how they are weighted in our decisions. In recent decades, the two measures we have put the most weight on are Real Personal Income less Transfer Payments and Nonfarm Payroll Employment.”
It also states that it measures US economic activity using both Real Gross Domestic Product (GDP) and Real Gross Domestic Income (GDI). Finally, the NBER's guidance is that it considers the quarterly averages of the monthly data series identified above, particularly for Nonfarm Payrolls and Personal Income less Transfer Payments.
Note
Because of the large distortions caused by the pandemic crisis, I am excluding the pandemic crisis period and providing two graphs for each data series.
-
Historical perspective before the pandemic crisis.
-
Current perspective after the pandemic crisis.
Let us start by examining the data that the Federal Reserve is currently assigning priority for decision making: Nonfarm Payrolls and Employment. To be consistent with the NBER methodology, all the data series will be evaluated using the quarterly averages.
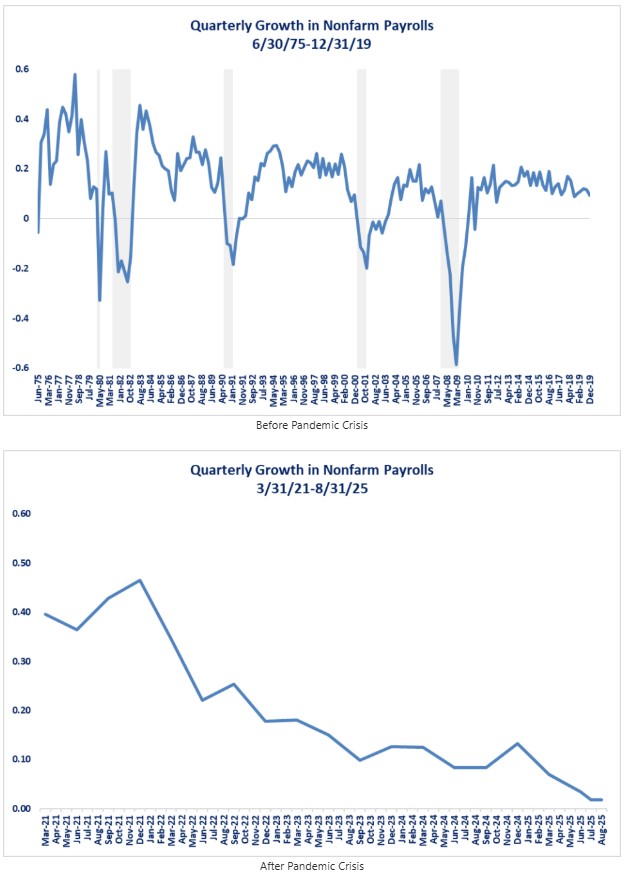
The first set of graphs shows the quarterly growth in Nonfarm Payrolls. As you can see, over the past 50 years, quarterly growth in nonfarm payrolls showed declines before the recession occurred. Currently, that pattern could best be described as one that is flashing red warnings lights as the trend is similar to the patterns that existed before each recession since the 1990's and the current growth level is below levels what existed before previous recessions.
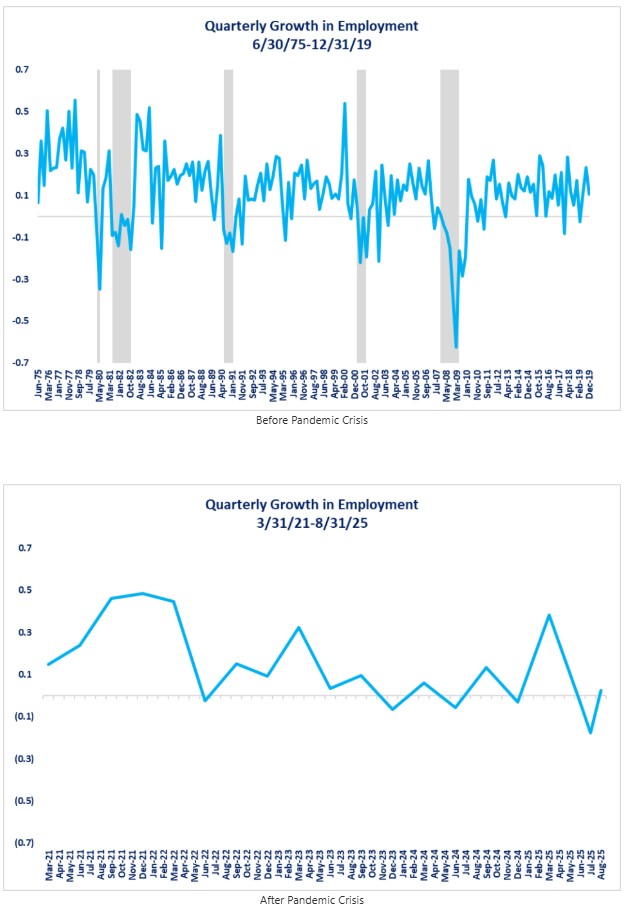
Next, let us examine the Employment series. What we can observe is that the quarterly growth for the Employment series fluctuated between 0.5% to 1.5% before a recession for two of the past recessions and between 0.0% to 1.0% for the other three cycles before a recession. Since 2021, the quarterly growth for the Employment series has fluctuated between 0.0% and 0.5% and is currently at 0% (0.02%). That is a warning signal.
Now, let us examine the data series related to the consumer: Real Personal Income less Transfer Payments and Real Personal Consumption Expenditures.
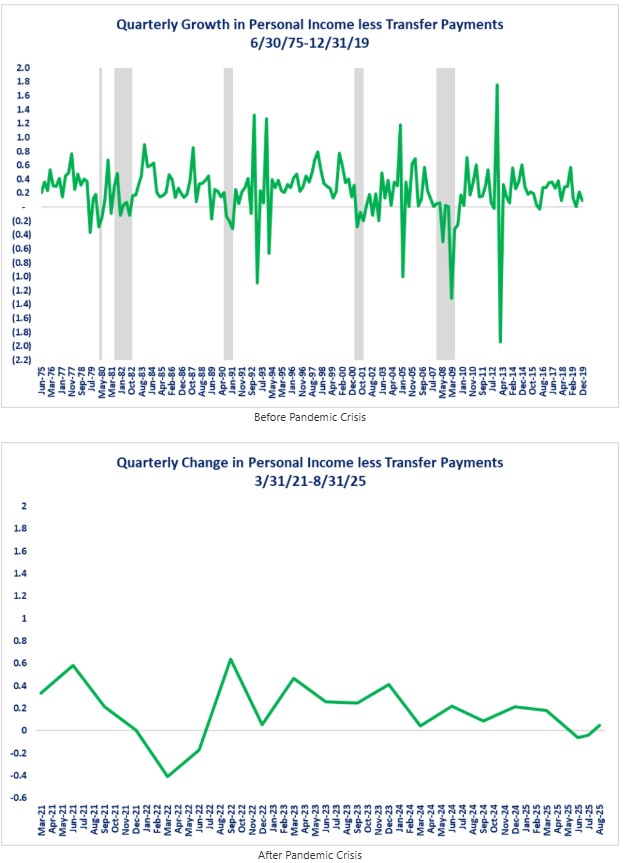
Examining the graphs for Personal Income less Transfer Payments reveals a less volatile pattern for the current economic cycle compared to previous economic cycles. Although the current growth rate is in the range where previous recessions started, the most recent data shows a slight uptrend which is different than periods before previous recessions. It remains to be seen if the uptrend continues, flattens, or starts to decline.
Spending by consumers has been the engine of growth for the US economy, so this series may take on more importance for the NBER as time passes. The current problem with this series is that it has a short historical record and only one recession has occurred since the inception of this series. You can see from the first graph that the growth rate declined just before the 2007 recession. Currently, the Real Personal Consumption Expenditures data series is in a short-term uptrend and does not show any evidence of the economy being at risk of a recession.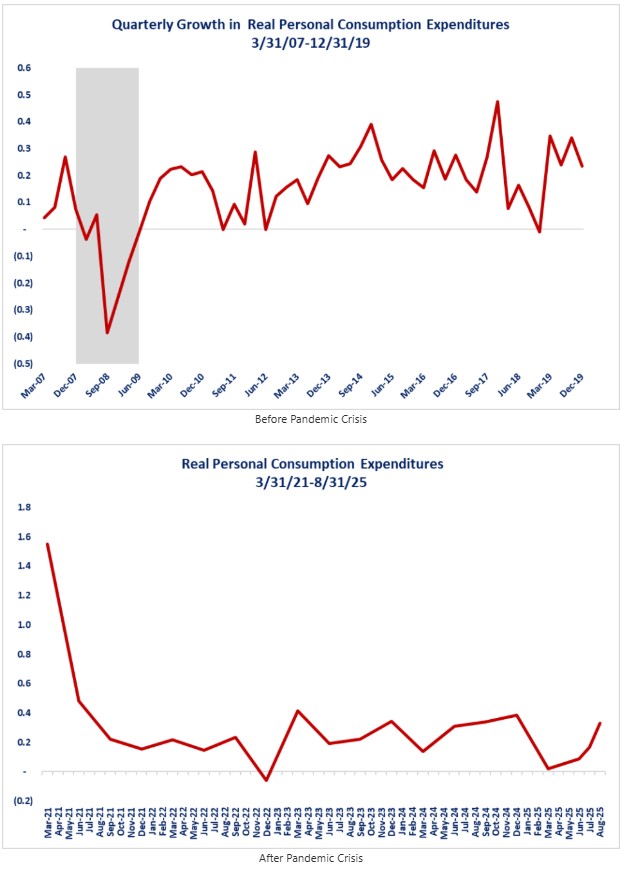
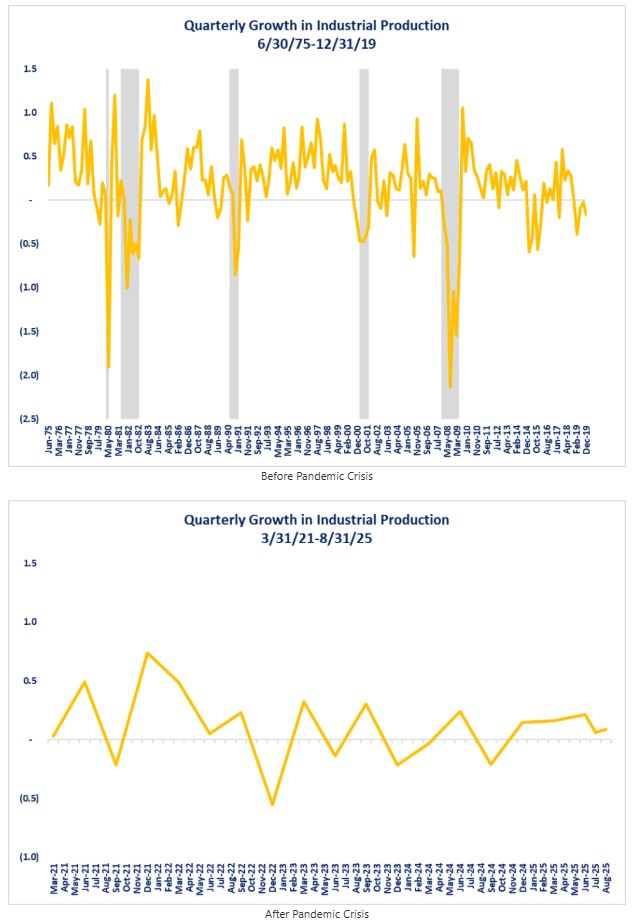
Let us examine the two economic series the NBER tracks that relate to the manufacturing side of the economy: Industrial Production and Real Manufacturing and Trade Industries Sales.
The graph below illustrates that this data series does not yet show evidence of a recession developing. The current data shown in the second graph shows a similar pattern of dipping in and out of negative growth during other economic cycles, but it is currently above levels that existed prior to past recessions. Based on historical data, one might argue that the 2020 recession may have actually started December of 2019.
Finally, let us examine the Real Manufacturing and Trade Industries Sales data. The series has been volatile since the pandemic crisis with a pattern of dropping in and out of negative growth on four separate occasions since the beginning of 2021. In past economic cycles, this series was negative two times before a recession and below 0.45% before the remaining recessions. Currently it is just above 0.50% and rising. This is another data series that was negative at the end of 2019 and would support the view that the February 2020 recession may have actually started at the end of 2019. If nothing else, the combination of the negative levels for both Industrial Production and this data series indicates that the manufacturing side of the economy may have entered into a recession before the rest of the economy at the end of 2019.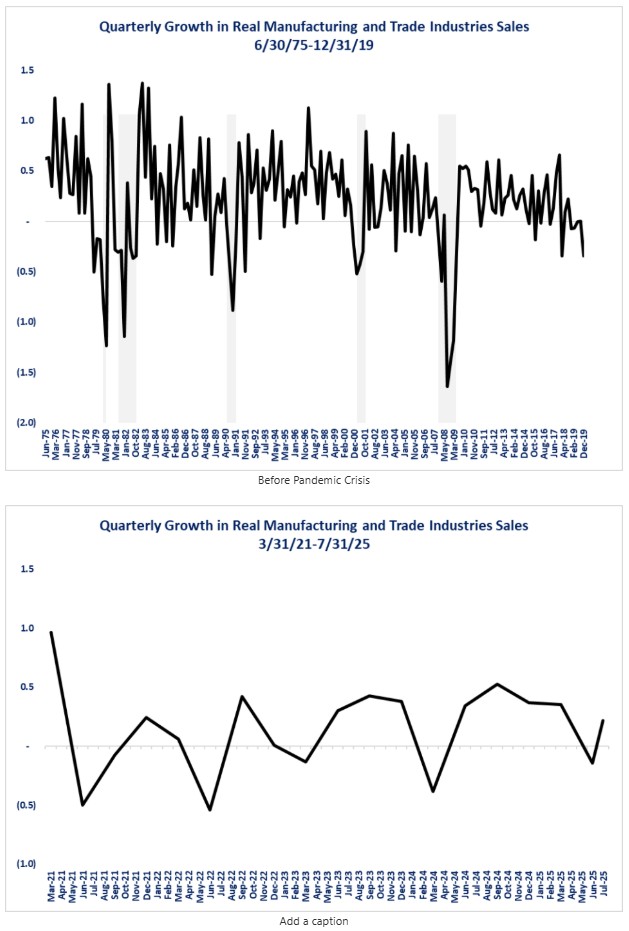
Conclusions
The current business cycle may present a greater challenge to the NBER in determining when a recession occurs. Currently the data shows a mixed picture. The jobs and employment data series are flashing warning signals of growing weakness, but the income and spending data remain positive and relatively stable, while the two manufacturing data series are not flashing warning signs at this time.
As I have cautioned many times in the past, we must recognize that macro data does not accurately reflect data for all sectors of the economy or all levels of income earners. The US economy is clearly bifurcated and what is happening with your personal economy is unique to you or your business. This is why I continue to suggest to businesses and individuals that the best way to understand their local economy and develop successful strategies to succeed is to believe what they observe around them and what they hear from the clients, vendors, friends, and families. National economic data is a valuablet tool in your economic toolbox, but it should not be the sole tool.
Disclosures

Steve is the Economist for Washington Trust Bank and holds a Chartered Financial Analyst® designation with over 40 years of economic and financial markets experience.
Throughout the Pacific Northwest, Steve is a well-known speaker on the economic conditions and the world financial markets. He also actively participates on committees within the bank to help design strategies and policies related to bank-owned investments.