


Economic Summary
As the government shutdown continues, economic news remains light. What we learned this week is that consumer sentiment fell further, the housing market appears to be treading water, headline and core inflation both rose 3.0% year-over-year, and manufacturing activity improved.
Consumer Sentiment
The University of Michigan Consumer Sentiment index fell from 55.1 to 53.6. The Current Condition sub-index fell from 60.4 to 58.6 and the Future Expectations sub-index fell from 51.7 to 50.3.
Inflation
The Consumer Price Index (CPI) rose 3.0% on a year-over-year basis in September. An 11.7% increase in natural gas prices led the increase. Core CPI also rose 3.0% with four categories experiencing price increases over 3.5%.
Housing
Mortgage applications fell for the fourth week in a row. Applications fell 0.3% after falling 1.8% the week before. The drop was due to a decline in applications to buy a house. Applications to purchase a house fell 5.0% while applications to refinance rose 7.8%. Existing home sales rose 1.5% in September after falling 0.2% in August.
Manufacturing
The S&P-Global Manufacturing PMI improves slightly from 52 in September to 52.3 in October. Manufacturing activity in the Kansas City Federal Reserve region improved from +4 in September to +15 in October.
Perspectives
This week continues an examination of consumer sentiment. Last week we examined the macro level data. This week I will examine sentiment broken down by five distinct factors.
- Regions of the US
- Income
- Age
- Education
- Political Party
Soundbite
The survey results sorted by the above factors are yet another illustration of the bifurcation in the US.
Based on the results of each factor examined, the composite profile of the person who is currently the most pessimistic is a middle-aged person (35-54 years old) who lives in the Western region of the US; is in the bottom third of income earners, with a college degree and identifies as a Democrat. The composite profile of the person who is currently the most optimistic is someone over the age of 55 who lives in the Southern region of the US, is in the upper third of income earners with a high school diploma or less and identifies as a Republican.
Analysis
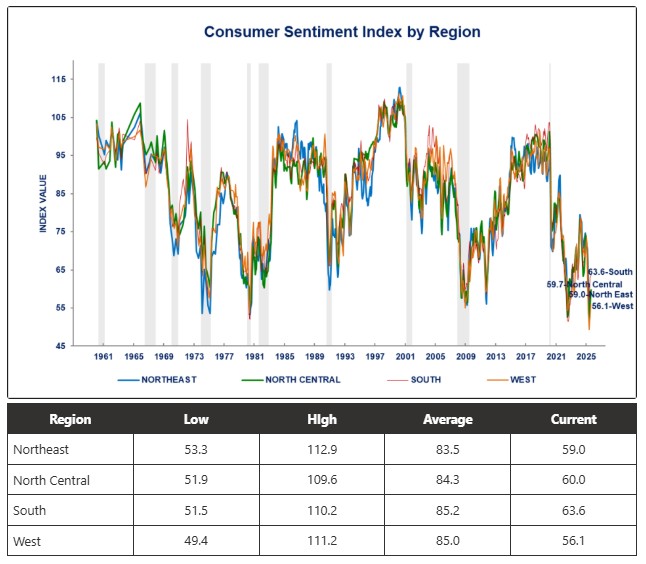
Let us start by examining consumer sentiment broken down by regions of the US. What we can see from the graph and table below is that all regions of the US are off their lows but still at historically depressed levels. The South is currently the most optimistic region while the West is the most pessimistic. The West is also the furthest away from its average while the South is closest to its average. Since the West has experienced natural disasters, loss of jobs in the tech, manufacturing, and construction sectors, and had national government intervention by way of the National Guard, it is not surprising that this region is the most pessimistic.
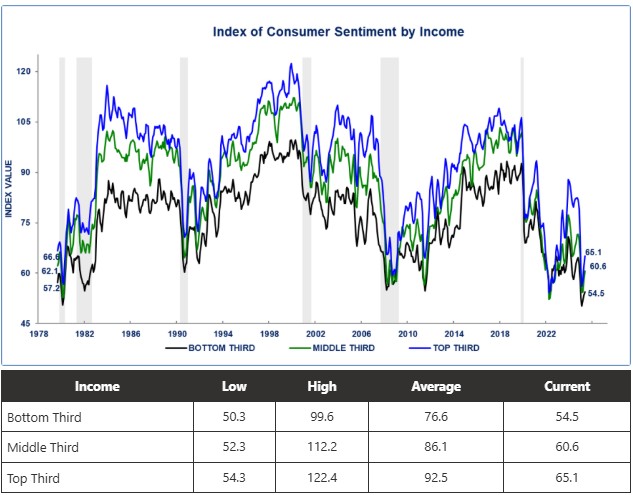
Now let us examine consumer sentiment by income level. The lowest income level is the most pessimistic while the upper income level is the most optimistic. This may be driven by the fact that, overall, high income earners are more likely to have assets that have helped offset the impact of inflation. Financial assets have appreciated faster than inflation, bonds have generated income to offset inflation, and rental properties have provided income to offset inflation. Most lower wage earners do not have the luxury of owning the above assets.
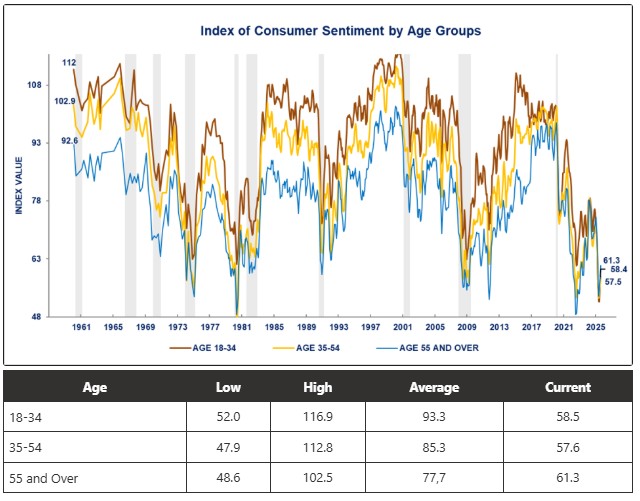
It may surprise you to discover that the middle age category is more pessimistic than the youngest age category. This may be a feature of the middle age group holding more debt than the younger and older age groups. The upper range of the middle age group may be facing the challenge of having their own student loan debt as well as tuition payments for their kids on top of their rent or mortgage payment. The younger end of the middle-age group may face daycare costs on top of student loan payments and rent/mortgage.
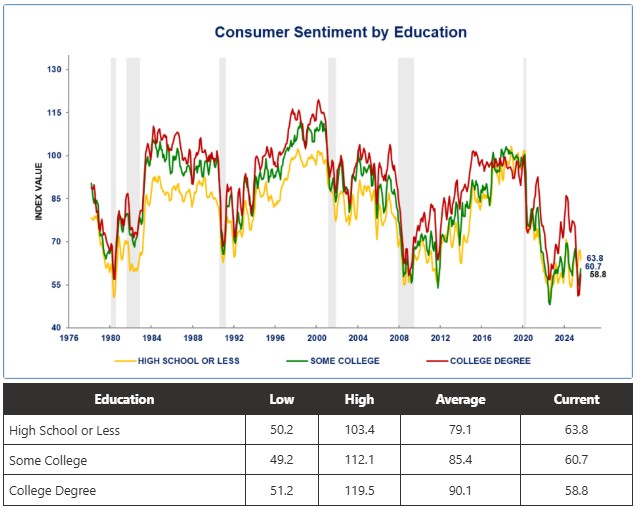
Despite all the arguments that a college degree will lead to a better job and higher pay, it clearly does not currently lead to a happier person based on the consumer sentiment results. This may be a result of the recent developments of businesses not being in active hiring mode. Based on the most recent data from the Bureau of Labor Statistics (August) the year-over-year growth rate for business hiring is -3.0%. This is resulting in college graduates having trouble finding a job in their career major. It has also made it harder for those who have been laid off to find a new job. With the layoffs that are occurring in the Technology sector, this impacts people who have a college degree.
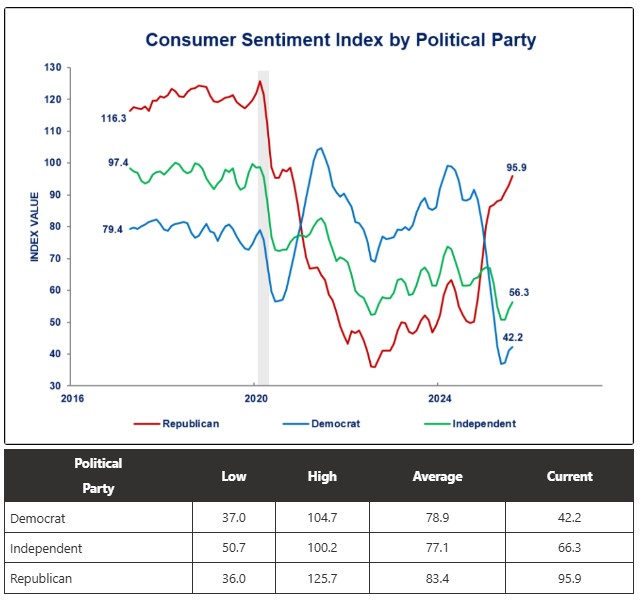
It should probably come as no surprise that sentiment filtered by political parties shows that sentiment ebbs and flows with what party is in charge. This filter has only been in place since 2016, so it does not have a long track record. You can see from the graph below that Republican sentiment plummeted when President Trump lost the 2020 election and Democratic sentiment soared. That reversed when President Trump regained the presidency in 2024. Currently, those who identify as Independents are more closely aligned with Democrats. Independents do not have the wide “mood” swings of the two major parties as their highs, lows, and average are more muted and sit between the two major political parties.
Conclusions
- Sentiment is an emotion that is influenced by a variety of factors. What this week's analysis shows is another example of bifurcation with each factor showing differences within the factor.
- If we create a composite picture of the most optimistic and pessimistic person we get the following.
- The most optimistic person lives in the South, is in the upper third of income earners, is over the age of 55 with a high school degree or less and identifies as a Republican.
- The most pessimistic person is someone who lives in the West, is in the bottom third of income earners, is between the age of 35 to 54, has a college degree and identifies as a Democrat.
- The most optimistic person lives in the South, is in the upper third of income earners, is over the age of 55 with a high school degree or less and identifies as a Republican.
- Sentiment levels separated by each factor are off their lows but continue to remain at levels that in the past would have indicated that the economy is close to or in a recession. The actual economic data does not support that conclusion. Thus, the advent of “vibecession” to represent an emotional recession.
- The biggest difference between now and history is the outsized influence that social media is having in shaping people's beliefs and sentiments.
Disclosures

Steve is the Economist for Washington Trust Bank and holds a Chartered Financial Analyst® designation with over 40 years of economic and financial markets experience.
Throughout the Pacific Northwest, Steve is a well-known speaker on the economic conditions and the world financial markets. He also actively participates on committees within the bank to help design strategies and policies related to bank-owned investments.