


Economic Summary
It was another week of both stale (September) and current (November) economic data as the government agencies continue to clear out the backlog created by the government shutdown.
Employment Costs
The Employment Cost index rose 0.8% in the 3rd quarter. The cost for both benefits and wages rose 0.8%.
Housing
The Mortgage Bankers Association reported a 4.8% increase in mortgage applications last week. This was driven by a 14.3% increase in refinancing applications. Applications to buy a house fell 2.4%. The average 30-year mortgage rate was essentially unchanged, as it was 6.33% last week compared to 6.32% the week before.
Interest Rates
The Federal Reserve lowered its overnight borrowing rate from 4.0% to 3.75%. Chairman Powell indicated that future rate cuts are not guaranteed and will be dependent on what the economic data shows for inflation and jobs.
Jobs
Initial jobless claims rose 44,000 last week after three weeks of declines. Continued claims fell 99,000.
The Bureau of Labor Statistics released the results for job openings for both September and October. Job openings rose from 7,227,000 in August to 7,658,000 in September. They increased further in October as openings rose to 7,670,000.
Leading Index
The Conference Board reported a 0.3% decline in its Leading Index in November. This matched the 0.3% decline in October. The declines are being driven by the continued declines in the consumer sentiment indices.
Small Business Confidence
The NFIB reported an increase in its Small Business Optimism Index The index rose from 98.2 to 99.0. The increase was driven by a surge in confidence that sales would increase. Small business owners continue to report that the biggest obstacle they face remains a lack of qualified help.
Trade Balance
The US Tade deficit improved from -59.3 billion to -52.8 billion. That was driven by a stronger increase in exports compared to imports. Exports grew from $280.8 billion to $290.3 billion. Imports increased from $340.4 billion to $342.1 billion.
Perspectives
The Census Bureau just released a report on the age of the labor force. The headline from the report is “The US Workforce is Aging.” To analyze this, the Census Bureau matched the administrative tax records of workers with the tax records of firms. This week's Perspectives section analyzes the results by firm size and age groups.
Soundbite
The data shows evidence that the US labor force is aging. This is happening primarily from older workers working longer and younger workers not entering the labor force (for a variety of reasons). The NFIB Small Business surveys continue to identify a lack of qualified help as the number one challenge for small businesses. This is a threat that cities and towns need to be aware of and find ways to attract qualified, work-ready workers to their locations or to keep the younger workers from leaving their locations. The threat of losing small businesses because they cannot find enough qualified help is a long-term threat to economic health of the city or town.
Analysis
A caveat to start off is that, even though the report was released on 12/5/25, the data is through 2022. Even though that seems like stale data, it still provides us insights into trends that have developed from 2006 to 2022.
The Census Bureau's methodology was to sort by company size, age, and percentage ranges. Its definition of company size is:
-
1-19 employees
-
20-499 employees
-
500+ employees
The age groups are:
-
14-24 years old
-
25-55 years old
-
55 and older
To avoid burying you in a multitude of graphs, I consolidated the percentage ranges into the following three:
-
0-24.99% of total employees
-
25-74.99% of total employees
-
75% to 100% of total employees
While the focus of the study was on workers that are 55 years or older, the data still breaks out the younger age groups as well. Let us start by working our way up from the smallest percentages to the highest and by examining what percentage of firms have less than 25% of the three age groups. What the first set of graphs illustrate is that firm size matters. For the smallest companies (1-19 employees), a smaller percentage of firms have less than 25% of their work force who are young (19-24 years old) or old (55+). The trend is clearly declining most for the 55 and over age group. For mid-size and larger companies, the trend is rising for the younger workers and declining for the older workers; meaning a smaller percentage of firms have less than 25% of their workforce that are older than 55 years old and a growing percentage of firms who have less than 25% of their workforce that is younger than 20 years old.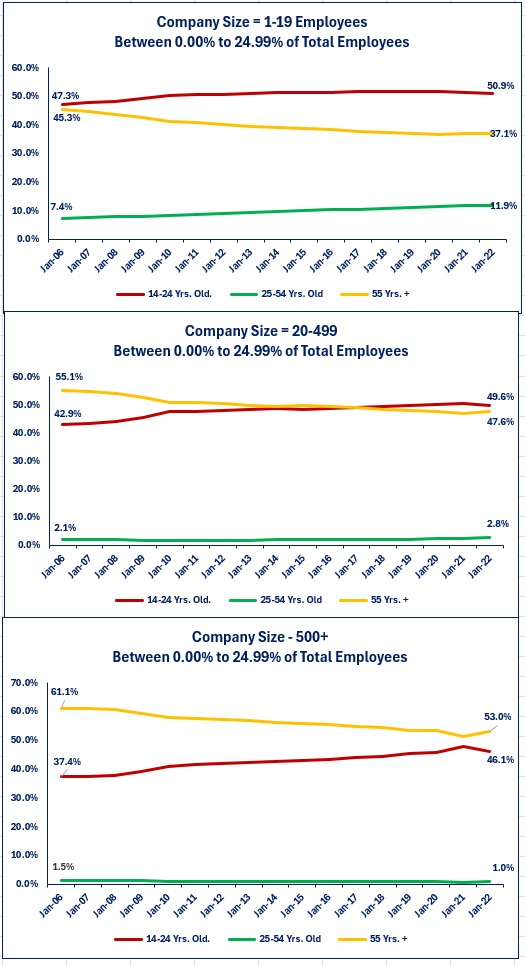
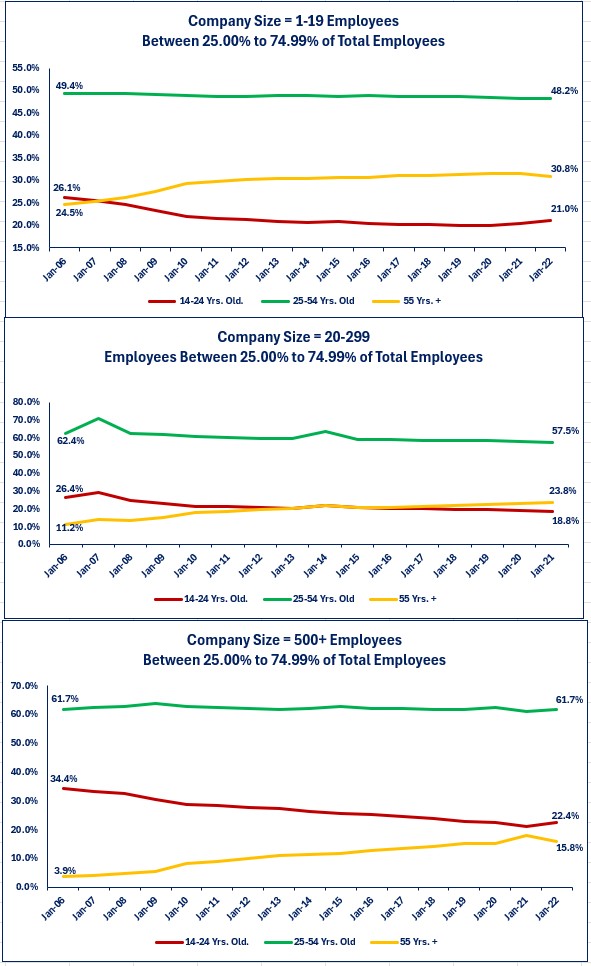
If we raise the bar to examine the 25% to 74.99% range, we see that the overall trend is rising for the 55 and older age group. That means more firms had an older workforce at the end of 2022 compared to 2006. That has come at the expense of the other two age groups as a smaller percentage of firms had between 25% to 74.99% of their employees in the other two age groups at the end of 2022 compared to 2006. The biggest decline has been in the youngest age group. This could be for a variety of reasons including, but not limited to the following possible factors;
-
Younger people are staying in school longer and not entering the job market until later,
-
Older people are working longer.
-
With wage costs rising and some states imposing minimum wage laws, companies may not be willing to hire inexperienced younger people the way they used to,
-
The rise of the “internet” economy where younger people a trying to make money through ventures like online gaming, being a social media influencer or trying to sell products online. These people are not part of the workforce that would be employed by a firm.
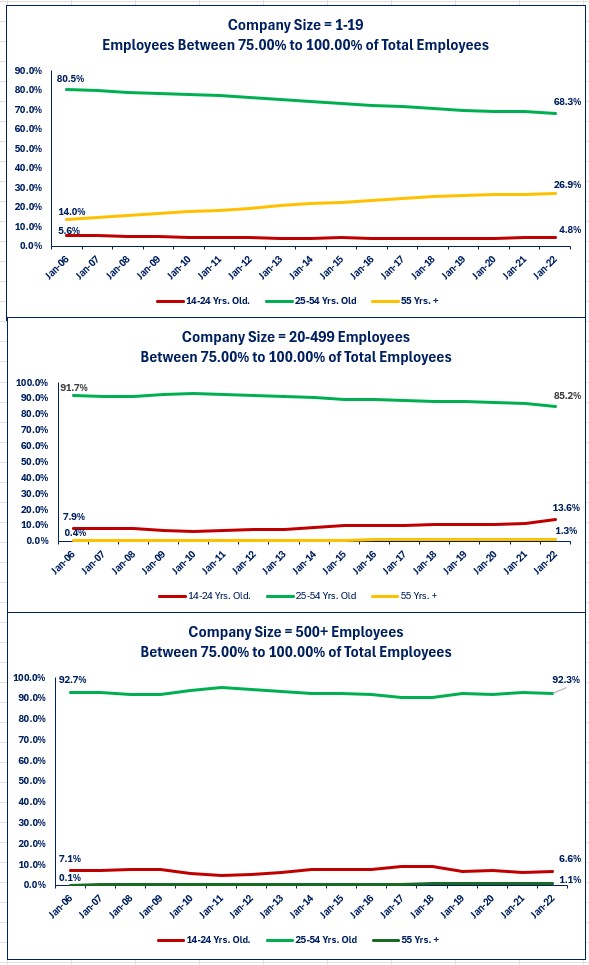
Finally, if we raise the bar to the highest and examine how many firms have between 75% to 100% of their workforce in any of the three age groups, we can see what I think we would expect to see. That is the fact that the prime working age group dominates this measure. It would be surprising to see a large percentage of companies that are concentrated on either young or old workers. A company with 75% to 100% of their employees 55 years or older would imply a company at risk of “aging out” since they do not have replacements for when an older person retires or stops working. What the graphs below show is that small firms have a growing percentage of their workforce that is over the age of 55. That is concerning since almost 27% of their workforce is 55 or older compared to small to midsize and large firms where the percentage is less than 2%. In my mind, the risks for those small companies with that type of exposure to an aging workforce is that it ends up closing its doors or selling out to a bigger business. The trend is more encouraging for small to mid-size businesses as the percentage of the 14 to 24 year old workforce is rising.
Conclusions
- The Census Bureau data shows that the workers age 55 and older have been the fastest growing age group in the labor force as it made up 22% of the total labor force in 2022 compared to 10% in 1994.
-
Examining by age and company size shows a trend rising for the 55 and older work force and declining for the 14 to 24 year old work force. As discussed above, there are a variety of factors that could be at play for these trends.
-
From a macro perspective, these trends create a risk that businesses-especially small businesses-face a risk of losing their work force if they are not adding and training younger workers to replace older workers.
-
The NFIB Small Business survey clearly identifies that lack of qualified help is the number one challenge that small businesses face. This could explain the decline in the youngest age group and the reason small businesses are retaining older workers.
-
Whatever the dynamics are that explain the trends that exist the message remains that small businesses face a risk that if they cannot replace their aging workforce, they may be forced to close their doors or sell out to a bigger business.
-
This is a threat that cities and towns need to be aware of and find ways to attract qualified, work-ready workers to their locations or to keep the younger workers from leaving their locations. The threat of losing small businesses because they cannot find enough qualified help is a long-term threat to economic health of the city or town.
-
Disclosures

Steve is the Economist for Washington Trust Bank and holds a Chartered Financial Analyst® designation with over 40 years of economic and financial markets experience.
Throughout the Pacific Northwest, Steve is a well-known speaker on the economic conditions and the world financial markets. He also actively participates on committees within the bank to help design strategies and policies related to bank-owned investments.