Perspectives
Soundbite
- Only six states (12%) meet the standard rule of thumb that a mortgage payment should not use more than 28% of your income. Using two incomes improves the results as all but seven states would then meet the 28% rule.
- If we apply the 28% rule for rent payments, only 38% of the states would meet that rule. Once again, if two incomes are used all but New York would meet the standard.
Observations
The median income data is from the Census Bureau as of 12/31/23. The median rent data is from Zillow as of 12/31/23 in order to match the time frame with the Census data. I recognize that this data is not as current as other data (like employment data) but it is the most recent at the state level. The top and bottom 10 states are being examined with regards to:
-
Median Income
-
Median Mortgage Payment
-
Median Rent Payment
-
Mortgage Payment as a Percent of Median Income
-
Rent Payment as a percent of Median Income.
As a reminder, the median is the middle of each data. That means that 50% of the households in the state are above the level while 50% are below.
-
In layman's terms that means that 50% of the households in the state are doing worse than the median and 50% are doing better.
-
Using median avoids potential distortions created when calculating averages when the size of states are different or if there are large outliers for a category.
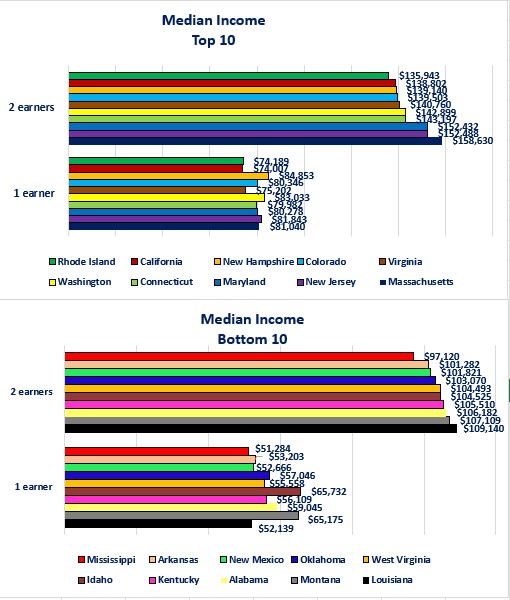
- Examining households where there is one income earner reveals the gap between the highest income state (New Hampshire) and the lowest (Mississippi) is $33,569 per year. That means the median income in the highest state is 1.7 times higher than that of the lowest state.
-
Ranking states by median income for households with two income earners, the gap between the top state (Massachusetts) and the lowest (Mississippi) narrows slightly to 1.6 times.
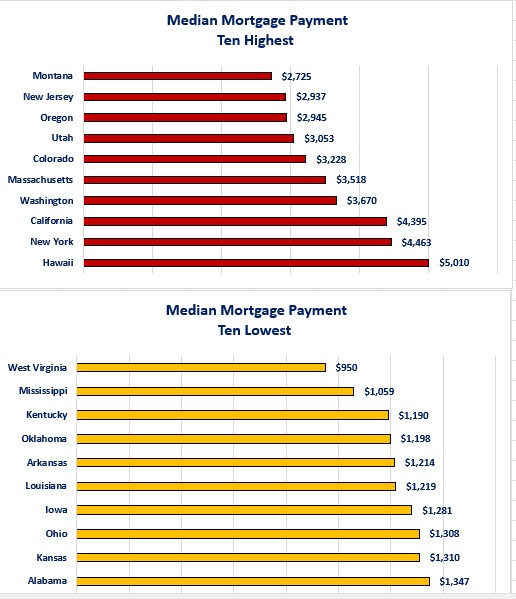
- It probably does not come as a surprise for most people to learn that Hawaii has the highest median mortgage payment in the US. Hawaii's median mortgage payment is 5.3 times higher than the state (West Virginia) with the lowest payment.
-
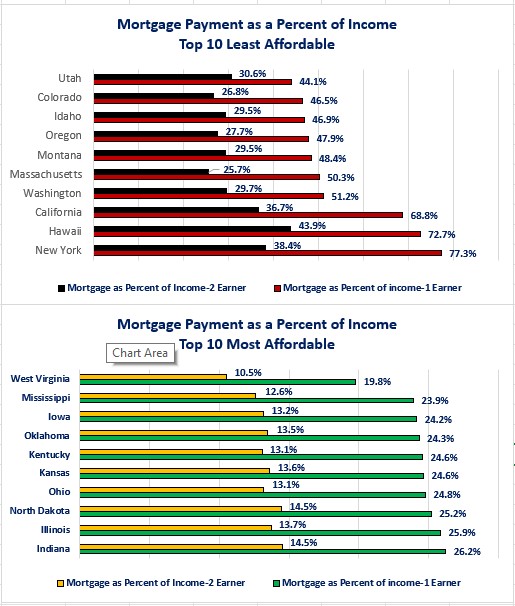
In five of the states in the Top Ten Least Affordable category the mortgage payment as a percent of income is over 50%. When using two income earners, only three of the top ten would meet the 28% rule.
-
All of the states in the Top Ten Most Affordable states meet the 28% rule with one income earner.
-
Overall, only sixteen states meet the 28% rule with one income earner. Using two incomes results in 84% of the states meeting the rule. If you are a household looking to be able to buy a house on one income, the states in the Top Ten Most Affordable category are the best of the sixteen states.
-
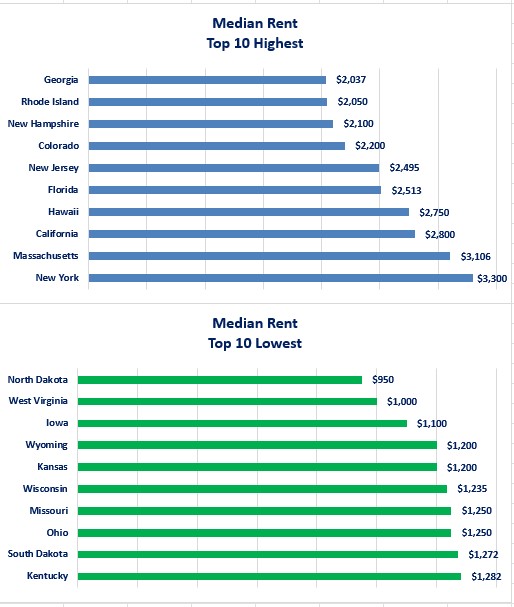
If buying a house is unaffordable, the next option is renting. The gap between the state with the highest median rent price (New York) versus the lowest (North Dakota) is $2,350 per month or $28,000 for the full year.
-
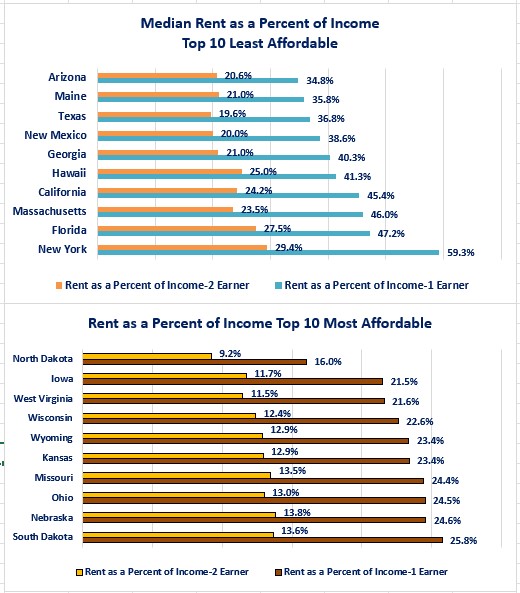
The picture is not much different when you substitute rent for mortgages. All of the states in the Top Ten least Affordable States category for rent exceed the 28% rule when considering one income earner. The picture is different when you have two income earners. Overall, eighteen states have median rents that would consume less than 28% of income from a one income earning household.
-
All of the states in the Top Ten Most Affordable category meet the 28% rule with one income earner. Having two income earners results in all states but New York meeting the 28% rule. The states in the Top Ten Most Affordable category are a slightly different makeup compared to affordability for mortgage payments. Only 50% of the states with the most affordable rent mortgage payments are in the top ten for mortgage payments.
Closing Thoughts
- The data shows that affordability for shelter is a problem in a majority of US states. The long-standing rule used to be that your mortgage or rent payment should not consume more than 28% of your monthly income.
- This is because of the other expenses that a household needs to cover.
- The goal of meeting this rule with one income earner is becoming harder as home prices remain elevated which cause mortgage payments to remain high and rent payment to remain high as demand for rentals stays strong.
- This is because of the other expenses that a household needs to cover.
- Some of the government agency mortgages will accept a higher percentage to qualify for a house.
-
The question becomes whether this is truly in the best interest of the homebuyer or if it puts them under financial stress that relies on salary increases being able to keep up with increases in other expenses (food, energy, medical, daycare, insurance, etc.).
-
When you have 35%-40% of your income being consumed by one expense, it may cause financial stress as other expenses rise.
-
-
The danger of relying on two income earners to buy a house or to rent an apartment/house is that they are your shelter, not an investment.
-
If something happens to one or both of the incomes (i.e., job loss, reduced hours, reduced income from savings due to declining interest rates, etc.) your shelter then becomes at risk.
-
-
The challenge for many households is that they may be facing the equivalent of three mortgage/rent payments.
-
Mortgage/rent
-
Student loans
-
Day Care
-
-
The challenge for many cities is that if shelter continues to be unaffordable for the average citizen, out-migration could result as people seek somewhere that they can afford the shelter.
-
As many people are forced to move farther away from the downtown core of a city in an effort to find affordable shelter it can cause undesired ripple effects.
-
The outlying areas start to see their affordability disappear because demand outstrips supply as more people move to these areas.
-
Infrastructure becomes stressed (i.e., streets, utilities, schools).
-
Urban sprawl develops.
-
People decide to leave the area completely in search of a cheaper state. This has become more feasible for some households with the advent of remote work.
-
-
Ultimately, if a state is viewed as having unaffordable shelter, it may constrain economic growth. A business that is considering locating in a certain state, or an existing business that is considering expanding may pass if its due diligence shows that shelter is unaffordable for its employees.
-
-
The bad news for those who live in the three states where Washington Trust Bank has offices (Idaho, Oregon and Washington) is that they live in states that rank in the top ten for least affordable shelter as measured by mortgage payment as a percent of income.
-
The better news is that these three states do not rank in the top ten for least affordable rent as a percent of income.
-
-
Unaffordable shelter in the majority of US states may present opportunities for states that are still affordable if they are seeking to attract new business and promote economic growth.
-
That is not as simple as it sounds as there are multiple challenges for a state to attract and support an influx of new businesses and people.
-
Without proactive policies that deliver a "we want you to come here” message and the support of the population to pay the taxes to support this type of growth, the risk becomes that the state simply becomes another unaffordable state due to the growth.
-
-
There is no easy solution for the affordable shelter problem. The only “easy” solution is that it will take the cooperation and coordination of all stakeholders.
-
Government
-
Builders
-
Existing citizens
-
Neighborhoods
-
-
Those states and cities that successfully address the shelter affordability issue will be the states that successfully bring all stakeholders together to identify the issues, consider new approaches, seek solutions, and agree to compromise to find the best overall answer.
Economic Data
|
Data |
Time Period Reported |
Current Result |
Previous Result |
Comments |
|
9/16/24 |
|
|
|
|
|
NY Federal Reserve Manufacturing Activity Index |
September |
+11.5 |
-4.7 |
This manufacturing index continues to be far more volatile than the other Federal Reserve regions. |
|
9/17/24 |
|
|
|
|
|
Retail Sales Year-Over-Year Change |
August |
+2.1% |
+2.9% |
The pace of sales slowed but still remains solid. |
|
Industrial Production Monthly Change |
August |
+0.8% |
-0.9% |
An increase in manufacturing production drove the increase. |
|
August |
+0.9% |
-0.7% |
Manufacturing production moved back into positive growth. |
|
NAHB Housing Market Index |
September |
41 |
39 |
Builders grew more optimistic in September. |
|
9/18/24 |
|
|
|
|
|
MBA Mortgage Applications Weekly Change |
9/13/24 |
+14.2% |
+1.4% |
This is the fourth consecutive increase in mortgage applications. |
|
9/13/24 |
+5.0% |
+2.0% |
Falling mortgage rates are bringing buyers back into the market. |
|
9/13/24 |
+14.2% |
+1.0% |
The continued decline in mortgage rates triggered a wave of refinancing applications. Mortgage rates fell to an average rate of 6.15%. |
|
Housing Starts Monthly Change |
August |
+9.6% |
-6.9% |
Single-family housing starts rose 15.8% while multi-family starts fell 6.7%. |
|
Building Permits Monthly Change |
August |
+4.9% |
-3.3% |
The growth in permits was driven by a surge in permit activity for multi-family construction. |
|
9/19/24 |
|
|
|
|
|
Initial Jobless Claims |
9/14/24 |
219,000 |
231,000 |
Initial claims fell 12,000 in the most recent reporting period. |
|
Continuing Claims |
9/7/24 |
1,829,000 |
1,843,000 |
Continuing claims fell 14,000. |
|
Philadelphia Federal Reserve Manufacturing Index |
September |
1.7 |
-7.0 |
Although the overall index rose into positive territory, new orders fell and prices that manufacturers paid for their materials rose. |
|
Existing Home Sales Monthly Change |
August |
-2.5% |
+1.3% |
Despite a $10,200 decline in the median home price, sales fell in August. |
|
Leading Index Monthly Changes |
August |
-0.2% |
-0.6% |
The Leading Index continued to fall, but at a slower pace. |

Steve is the Economist for Washington Trust Bank and holds a Chartered Financial Analyst® designation with over 40 years of economic and financial markets experience.
Throughout the Pacific Northwest, Steve is a well-known speaker on the economic conditions and the world financial markets. He also actively participates on committees within the bank to help design strategies and policies related to bank-owned investments.


