


Economic Summary
It was a busy week of economic data releases packed with a combination of stale and current data.
Consumer Sentiment
The University of Michigan Consumer Sentiment Index showed improvement in December but remained at a depressed level. The index rose from 51.0 in November to 52.9. The Current Conditions sub-index continued to decline as the index fell from 51.1 to 50.4. Consumers are more optimistic about the future as the Future Expectations sub-index rose from 51.0 to 54.6.
Debt
The Federal Reserve reported a $9.2 billion increase in consumer credit in October. Revolving credit rose $5.4 billion while non-revolving credit rose $3.8 billion.
Housing
The National Association of Home Builders (NAHB) reported improvement in its Housing Market Index. The index rose from 38 in November to 39 in December. The Mortgage Bankers Association reported a 3.8% decline in mortgage applications last week after rising 4.8% the week before. Applications to buy a house fell 2.8% while applications to refinance fell 3.6%. A rise in the average 30-year mortgage rate from 6.33% to 6.38% contributed to the decline. Weather was also a factor. The growth of existing home sales slowed in November. Sales rose 0.5% compared to a 1.5% increase in October.
Inflation
The Bureau of Labor Statistics (BLS) released the November data for the Consumer Price Index (CPI). CPI rose 2.7% on a year-over-year basis while Core CPI rose 2.6%. No data was released for October due to the government shutdown. There is already an ongoing debate occurring over the accuracy of the report due to staffing issues at the BLS.
Jobs
The Bureau of Labor Statistics (BLS) released jobs data for both October and November this week. The nation lost 105,000 jobs in October due primarily to a 157,000 loss in government jobs. The nation added 64,000 jobs in November. For November, Healthcare jobs accounted for 100% of jobs growth on a net basis as the remaining industry had gains in some industries that were offset by losses in other industries. Seven industries gained jobs, and eight industries lost jobs. The unemployment rate rose from 4.4% to 4.6% due to increases in the unemployment rate for people with college degrees. Average monthly wages rose 3.5% year-over-year. Initial jobless claims fell 13,000 as of 12/13/25 while continuing claims rose 67,000 as of 12/6/25.
Manufacturing
Manufacturing contracted in December based on four reports released this week. The Kansas City Federal Reserve reported manufacturing activity in its region fell into contraction in December. Its manufacturing activity index fell from +18 in November to -3 in December. The New York Federal Reserve reported similar results for its Empire State Manufacturing Index. The index fell from +18.7 in November to -3.9 in December. The Philadelphia Federal reserve reported a further decline in manufacturing activity in its region. Its manufacturing activity index fell from -1.7 in November to -10.2 in December. Finally, S&P-Global reported a decline in its Manufacturing PMI index as the index fell from 52.2 in November to 51.8 in December. A reading above 50 still indicates growth but the decline showed growth is slowing.
Retail Sales
Despite slow jobs growth, the Census Bureau reported a 3.5% year-over-year increase in Retail Sales as of October. This was a slowing from the 4.2% pace in September. Online sales drove the increase as they rose 9.0%.
Service Sector Activity
S&P-Global reported slowing in the service sector as its Services PMI fell from 54.1 in November to 52.9 in December.
Perspectives
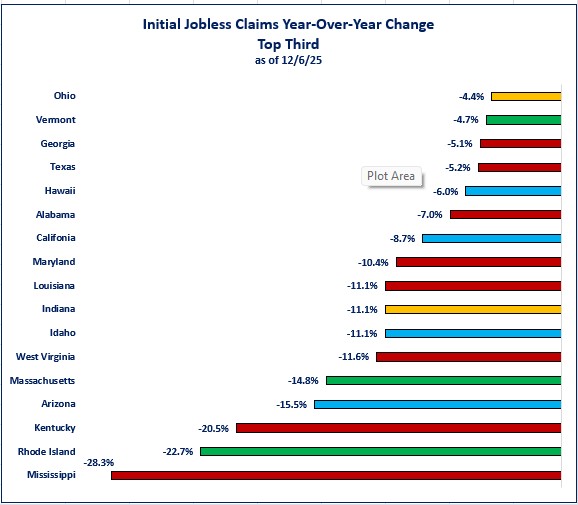
The Federal Reserve continues to lower interest rates based on its concern over the health of the labor market. There are multiple government economic data series related to jobs and the labor market. The problem for most is that they rely on surveys to derive results. One data series that does not rely on surveys is the Department of Labor's initial and continued jobless claims. This data series is derived from actual filings reported by the states. This week's Economic Perspective examines the year-over-year change in both initial and continued claims at the state level.
Methodology
- I am measuring the year-over-year change in both types of claims to give us perspective on what has changed over the past year.
- Results are broken into thirds: top, middle, and bottom.
- States were also identified by regions based on the four major regions used by the Census Bureau.
- Midwest
- Northeast
- South
- West
Soundbite
As we learned from the jobs reports that were released this week, companies are not actively hiring. What the weekly jobless claims data shows us is that companies are not actively firing (i.e., layoffs) either. Despite the layoff announcements from some of the large S&P 500 companies, overall layoffs have only risen 1.2% in the US over the past year. The initial and continued jobless claims data highlights another example of the bifurcations in the US economy. There are twenty-one states that experienced a decline in initial jobless claims compared to a year ago and twenty-four that experienced an increase. There are twenty-two states that experienced a decline in continued claims while 23 states experienced an increase. Since both initial and continued claims are actual claims filed with state employment agencies rather than surveys that are used for the job reports, these two data series are worth monitoring for labor market health.
Analysis
When an employee becomes unemployed, they will go to their state employment agency to file for unemployment benefits (assuming they qualify). The process of initially filing for unemployment benefits is called an initial claim. If they do not find a job within the first week, they must continue filing for benefits each week. This process is called a continued claim. As stated above, these are actual claims being filed, not surveys. They are also not seasonally adjusted, so the data is the actual number of claims being filed for each state. To me, these claims give one of the best pictures regarding the health of the labor market and the data is the closest to real time since the data is reported weekly. One note is that continued claims are reported with a one-week delay while initial claims are data for the previous week.
Note:
The graphs are color coded by the four regions of the US used by the Census Bureau.
Yellow: Midwest
Green: Northeast
Red: South
Blue: West
Examining the middle third once shows a mix of states with declines in initial claims and states with increases. All four regions had at least two states in the middle third. North Carolina showed the best results for the middle third with a 3.3% decline from a year ago. The Midwest region had five states in the top third which is 29% of the top third. The West region was close behind with four states, representing 24% of the top third. You can also see from the graph below that the US falls into the middle third category and experienced a slight increase in initial claims compared to a year ago. For the US, the increase was 1.2%.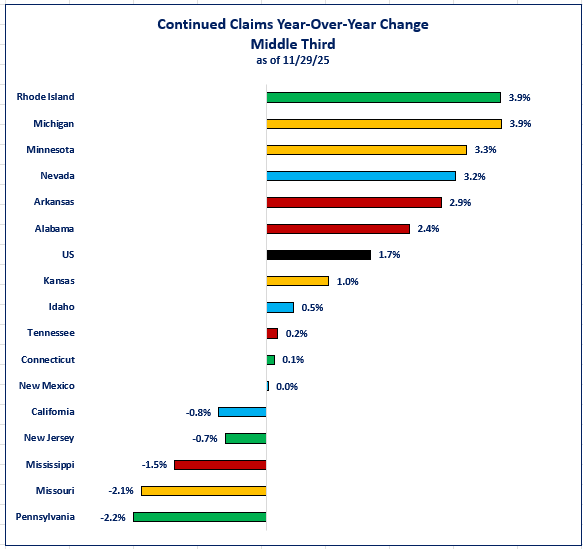
States in the bottom third all experienced increases in initial claims compared to a year ago. The bottom third had at least one state from each of the four regions. Only New Hampshire landed in the bottom third for the Northeast region. All states in the bottom third had double digit increases in initial claims compared to a year ago. Virginia had the smallest increase at 11.2%, while Delaware had the largest increase at 64.0%. The West region had the most states in the bottom third with six states. The West region made up 35% of the bottom third while the Midwest made up 29%.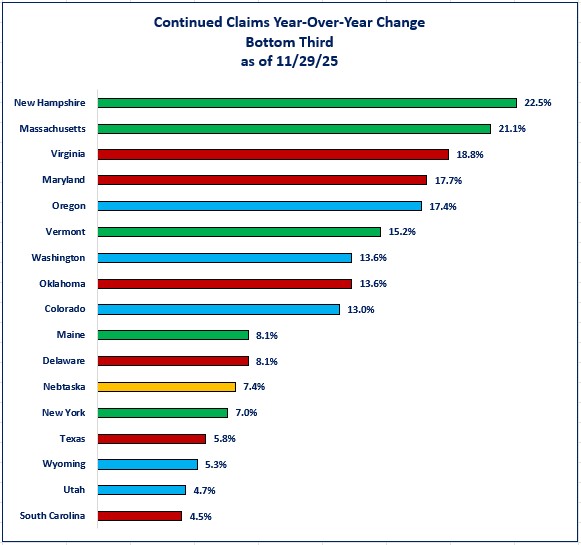
Now, let us examine what is happening for those who did get laid off. With a robust jobs market, people who are laid off should be able to find new jobs quickly. This should result in people quickly dropping off receiving continued benefits. If the jobs market is weak, continued claims should rise as existing people continue to receive benefits while new people are being added each week.
Examining the top third shows that all states in the top third experienced decreases in continued claims. The mix is different though because of the seventeen states that were in the top third for initial claims, only eight are in the top third for continuing claims. North Carolina showed the best year-over-year improvement as continued claims fell 36.8%. The Midwest region had the most states in the top third for continued claims. Seven Midwest states were in the top third. This represents 41% of the top third. The Northeast region did not have any states in the top third.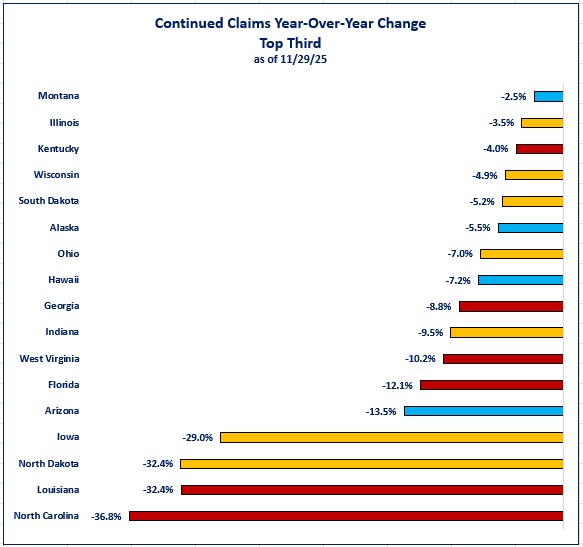
The middle third is a mix of states with decreases and increases like the pattern with initial claims. When examining the middle third of the states, we learn that Pennsylvania had the best results for the middle third with a 2.2% decline. All states were equally represented in the middle third as all four regions had four states in this tier. The US landed in this tier to round out the seventeen constituents. For the US, continued claims experienced a similar growth rate as initial claims. Continued claims rose 1.7% compared to 1.2% for initial claims. For the US, that indicates it is taking longer for people to find work since continued claims have grown more than initial claims.
The South had the most states in the bottom third with six states (35%) while the Northeast and West each had five (29%). The Midwest had only one state in the bottom third. South Carolina showed the smallest increase in continued claims at 4.5% while New Hampshire had the highest at 22.5%.
Caveat:
Before we jump to any conclusions about the results for continued claims it is important to understand a key feature of continued claims. The Department of Labor allows continued claims payments for a maximum of 26 weeks under normal circumstances. States are free to set their own maximum time limits. As a result, we cannot conduct an “apples-to-apples” comparison by looking at the percentage change. The following are states that do not offer 26 weeks of maximum payments.
- Arkansas and North Carolina: 12 weeks
- Georgia: 12-20 weeks (indexed to the state's unemployment rate)
- Florida: 12-23 weeks (indexed to the state's unemployment rate)
- Alabama: 14-20 weeks (indexed to the state's unemployment rate)
- Oklahoma: 16-20 weeks (up to 26 weeks if continued claims exceed 40,000)
- Iowa and Kansas: 16 weeks
- Massachusetts is 26 weeks but allows up to 30 weeks when metro unemployment is above 5.1%.
Although we cannot compare states against each other, we can examine the difference in growth for initial claims versus continued claims on an individual state basis. States that have either a higher growth rate for continued claims versus initial claims or a lower decline in continued claims versus initial claims indicate that it is taking longer for people in those states to find a job. There are 19 states that have faster growth or slower declines in continued claims versus initial claims and 31 states that have slower growth or faster declines.
- 13 states have a faster year-over-year growth rate for continued claims versus initial claims.
- 6 states have a smaller year-over-year decline in continued claims compared to initial claims.
- 15 states have a slower year-over-year growth rate in continued claims compared to initial claims.
- 16 states have a bigger decline in year-over-year growth for continued claims compared to initial claims.
You might question how the unemployment rate can be rising and yet initial jobless claims are not rising much. The answer to that question is you had to have a job and become laid off to file for unemployment benefits. That means that someone who was not working and started to look for a job (i.e., finished school, completed military duties, was released from incarceration, became old enough to work, came out of retirement, etc.) was unemployed but not eligible for unemployment benefits.
Conclusions
As we learned from the jobs reports that were released this week, companies are not actively hiring. What the initial claims data shows is that companies are also not actively firing (i.e., layoffs) either. Even though the media has highlighted layoffs in many of the S&P 500 size companies, that is not the story for the US as a whole. Initial claims have only risen 1.5% compared to last year. Continued claims have only risen 1.7%. Bifurcation exists with both initial and continued claims. 21 states (42%) experienced declines in initial claims while 24 states experienced an increase. 22 states (44%) experienced year-over-year declines in continued claims while 23 states experienced an increase. So far, layoffs are not the problem that the media has been portraying. Whether they begin to become a problem remains to be seen, but monitoring the initial claims weekly data should provide us with a warning if that trend changes. Monitoring continued claims data should help us understand if it is taking longer for people to find new work. So far, the continued claims data shows a similar pattern as initial claims, although the constituent states within each tier is different.
Disclosures

Steve is the Economist for Washington Trust Bank and holds a Chartered Financial Analyst® designation with over 40 years of economic and financial markets experience.
Throughout the Pacific Northwest, Steve is a well-known speaker on the economic conditions and the world financial markets. He also actively participates on committees within the bank to help design strategies and policies related to bank-owned investments.