


Economic Summary
This week's economic data was dominated by jobs data.
Jobs
Most of the jobs data reinforced the “low hire, low fire" mantra that many economists and analysts are using. On the “low hire side” ADP reported a 62,000 increase in private jobs creation in March. This is similar to the 66,000 increase in February. The Bureau of Labor Statistics reported hiring fell by 498,000 in February. Quits fell 157,000, and job openings fell 358,000. Data on the “low fire” side were from Challenger and the Department of Labor. Challenger reported a 78% year-over-year decline in announced layoffs in March, and the Department of Labor reported a 9,000 decrease in initial jobless claims. Continuing claims increased 25,000. The outlier was the Bureau of Labor Statistics jobs report. It reported 178,000 jobs were added in March which exceeded the consensus forecast of 70,000. The unemployment rate fell from 4.4% to 4.3% and average weekly earnings rose 3.5%.
Consumer confidence improved in March as the Conference Board reported its Consumer Confidence Index rose from 91.0 in February to 91.8 in March.
Despite the uncertainty and volatility over the past year, the consumer kept spending. This was evidenced in the Census Bureau's Retail Sales report. Retail sales increased 3.7% year-over-year in February compared to a 3.2% increase in January.
Finally, the housing market continues to be hurt by rising interest rates. The Mortgage Bankers Association reported the average 30-year mortgage rate rose from 6.43% to 6.57% last week. As a result, mortgage applications fell 10.4% after falling 10.5% the week before. Applications to buy a house fell 2.6% while applications to refinance fell 17.3%.
Perspectives
Soundbite
The clear takeaway from the four survey categories examined this week is that size matters. The data highlights that the smallest businesses are structurally vulnerable to disruptive events like tariffs and wars. The unanswered question is: are disruptive events going to be the "new normal" and if they are, will advances in innovation, technology and productivity allow small businesses to adapt?
Analysis
The analysis will examine the net percentage for four categories. Net percentage means subtracting the percentage of respondents reporting increases over the past two weeks minus those reporting decreases. For the performance category, it is the sum of the percentage reporting performance was excellent or above average minus the sum of those reporting performance was below average or poor. The following are the four categories being examined.
-
Prices paid
-
Prices charged
-
Revenue
-
Performance
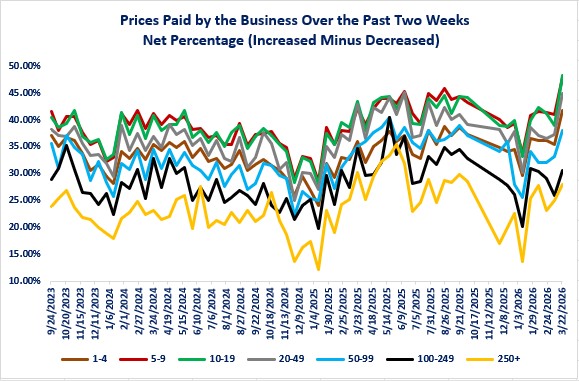
Let us start by examining prices paid by small businesses. The graph below highlights three major points.
-
There is a cyclicality to the net percentage in prices paid. The pattern is that the net percentage for prices paid declines in the fourth quarter of each year and then rebounds.
-
Small businesses with less than 20 employees are suffering the most from price increases as the three categories (1-4, 5-9, and 10-19) are currently at all-time highs for the net percentage reporting price increases. Interestingly, the smallest business size does not have the highest net percentage. Firms with 1-4 employees currently have a net percentage of 41.6% while firms with 10-19 have the highest net percentage at 48.1%.
-
The gap between the 250+ category and the 10-19 category is substantial. At the start of the survey (9/24/23), net percentage for firms with 10-19 employees was 40.3% compared to 23.8% for firms with 250+ employees. As of the most recent results (3/22/26) the net percentage for firms with 10-19 employees is 48.1% versus 27.9% for firms with 250+ employees.
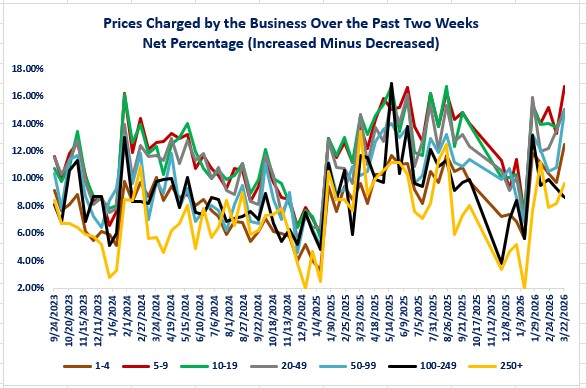
Given the rising trend for price increases, the question is whether firms were able to pass these increases through to the price of their final product. We can examine that by using the survey results for the net percentage of small businesses reporting they raised prices. The graph below on prices charged shows the following major patterns.
-
Cyclicality remains in place like the price paid cyclicality.
-
The two smallest size businesses (1-4 and 4-9 employees) are at all-time highs, but the 50-99 category is the third category currently at an all-time high.
-
The net percentages are far smaller for prices charged than the net percentages for price paid. The prices paid net percentages currently range between 27.9% to 48.1% while the net percentages for prices charged currently range between 8.6% to 16.7%. This indicates that profit margins are being squeezed.
-
The trend for prices charged has picked up meaningfully compared to last March. The net-price raising net percentage is up between 4-6 percentage points compared to March 2025.
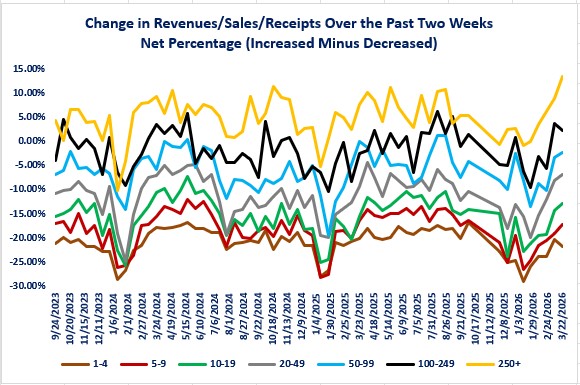
Next, let us examine what the trend is for the revenues/sales/receipts (revenues) category.
-
Cyclicality remains in place.
-
The recovery from the drop in January has been highlighted by the fact that companies with 250 or more employees recovered the fastest and is the only size category that is at an all-time high.
-
The startling result is that the net percentage for companies with less than 100 employees (four categories) has been negative throughout the survey period.
It is important to remember that this data is not inflation adjusted. As a result, we do not know how much of the net percentage increase is due to companies selling more of their product or simply due to higher prices being charged.
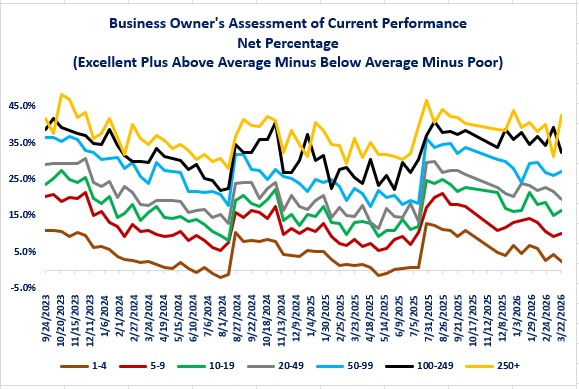
Examining revenue data does not give us a picture of the profitability of a business. If your expenses (i.e., prices paid) rise faster than your revenue, then a business' profitability is hurt. The Census Bureau does not specifically survey businesses on profitability. It does ask business owners for their assessment of their business' current performance. Logically, a business with poor profitability would assess their performance as below average or poor compared to a business with healthy profits that would rate their performance as above average or excellent.
The graph below shows the opposite picture as the revenue graph. The net percentage is falling due to a combination of a decline in the Excellent and Above average categories and in increase in the Below Average and Poor categories.
-
The seasonality is the opposite of the revenue and price graphs as the net percentage spikes higher at the beginning of a year and then declines.
-
Once again, the 250+ category is the outlier as its net percentage dropped below the 100-249 category as of 3/8/26 but then spiked back above as of 3/22/26.
-
The gap between the biggest and smallest employee size categories has widened from 30.8 percentage points as of 9/24/23 to 40.0 percentage points as of 3/2/26.
Conclusions
-
The picture that the graphs and data paint is one of bifurcation like we have seen with other economic data. Simply stated, size matters when it comes to prices, revenue, and performance for small businesses.
-
The survey results highlight the impact of disruptive events (i.e., tariffs and wars) on small businesses. The output costs hit small businesses quickly while their ability (or willingness) to pass through the costs is slower.
-
Note: since the most recent survey is as of 3/22/26, it references the two weeks before. As a result, the most recent results cover the first week of the war with Iran.
-
-
The worrying message is that price increases for consumers may not be over. Since input costs (prices paid) are accelerating faster than output cost (prices charged) for virtually all firm sizes, small businesses may be forced to raise prices more to maintain profitability.
-
The risk is, since bigger businesses appear to be managing input costs better than smaller businesses, they may view this as an opportunity to gain market share by undercutting the smaller business on prices charged.
-
-
The biggest of the small business sizes (250+) currently appeared to have weathered the tariff world of 2025 far better than smaller business and the trend is continuing in 2026. This is a structural size issue.
-
The unanswered question is: are disruptive events going to be the "new normal" and if they are, will advances in innovation, technology and productivity allow small businesses to adapt?

Steve is the Economist for Washington Trust Bank and holds a Chartered Financial Analyst® designation with over 40 years of economic and financial markets experience.
Throughout the Pacific Northwest, Steve is a well-known speaker on the economic conditions and the world financial markets. He also actively participates on committees within the bank to help design strategies and policies related to bank-owned investments.