


Economic Summary
It was a week of steady economic data releases with all eyes on the two inflation reports that came out.
Inflation
The Personal Consumption Expenditures (PCE) price index showed no change from January as the February data showed another year-over-year increase of 2.8%. The Core PCE price index rose 3.0% after rising 3.1% in January. The Consumer Price Index (CPI) experienced the pain of rising energy costs and airfare. CPI leapt from a 2.4% year-over-year rate in February to a 3.3% rate in March. Energy costs rose 12.5% and airfare rose 14.9%. Core CPI (excluding food and energy) rose from 2.5% in February to 2.6% in March.
Jobs
Initial jobless claims rose 16,000 last week but remain in the 200,000 to 250,000 range as the total initial claims last week were 219,000. For people continuing to file for unemployment benefits, the results improved. Continued claims fell 38,000 to 1,794,000.
Housing
The MBA reported a slight decline to the 30-year mortgage rate last week as the average fell to 6.51% from 6.57% the previous week. Mortgage applications were close to unchanged with a 0.8% declined. Applications to purchase a house rose 1.1% while applications to refinance fell 2.8%.
Manufacturing
Durable goods orders fell 1.4% for the month of February after falling 0.5% in January. Core durable goods orders rose 0.8% after rising 0.3% in January.
Real Personal Income
Real personal income rose 0.9% year-over-year in February. This was a decline from the 1.5% pace in January.
Real Personal Spending
Even though income growth slowed, the consumer continued to spend. Real personal spending rose 2.5% year-over-year in February after rising 2.2% in January.
Consumer Sentiment
The University of Michigan released its preliminary results for its Consumer Sentiment index. The index dropped sharply from a 53.3 level in March to 47.6 in April. The Current Conditions subindex from 55.8 to 50.1 and the Future Expectations subindex from 51.7 to 46.1.
Perspectives
Soundbite
Residential construction boomed when the Federal Reserve kept interest rates suppressed until 2022. Nonresidential construction took over the mantle of booming growth thanks to the multiple stimulus acts passed by Congress.
Manufacturing was the major beneficiary of the fiscal policy stimulus. As is typical when above normal growth occurs, both sectors have now slowed as high interest rates and inflation have put the brakes on growth.
Residential construction will remain dependent on interest rates, construction costs, and government policy (i.e., permits, zoning, regulations, etc.). The open question for the nonresidential sector in 2026 is whether war driven price increases as well as potential new tariff headwinds cause further deceleration or whether reshoring and increased spending from corporations to increase productivity support construction demand.
Analysis
Let us start by examining total construction spending. It is a bit breathtaking to see the impact of stimulus and low interest rates.
You can clearly see the “surge” effect that happened starting in 2020 that reached its peak in 2022. Realistically, when you achieve double-digit year-over-year growth for the whole industry-two years in a row (10.3% in 2021 and 15.1% in 2022) and almost double-digit growth in 2023 (9.1%), it is difficult to sustain that momentum. The downturn in 2025 looks like the start of a normalization process from an exceptional, policy-driven expansion.
Even with the negative growth in 2025, it is important to keep the perspective that the level of construction spending is 113.5% higher than it was 10 years ago. 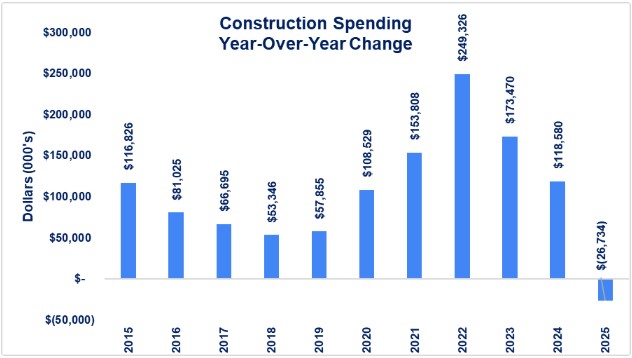
If we examine the year-over-year change in construction spending broken down by its two major categories-residential and nonresidential-an interesting story is revealed. I call it the tale of two surges that resulted from fiscal and monetary policy after the pandemic crisis.
Examining the graph below you can see that residential construction spending started to surge in 2020, peaked in 2021, and then slowed but remained elevated in 2022. This can be traced to the combination of fiscal stimulus helping offset the impact of the pandemic recession and the Federal Reserve suppressing interest rates which resulted in mortgage rates below 4%.
Once the Federal Reserve started raising interest rates in 2022, residential construction slowed sharply compared to the peak level of the year before. As the residential surge began to subside in 2022, the nonresidential surge began in 2022, peaked in 2023, and then slowed in 2024.
The surge in nonresidential construction spending can be traced to the fiscal stimulus acts passed during the Biden administration. The three stimulus bills and low interest rates stimulated a surge in spending in manufacturing (computer chips), infrastructure (highways) and commercial (warehouses and distribution centers). As most of those funds were distributed and interest rates rose, the pace of spending slowed.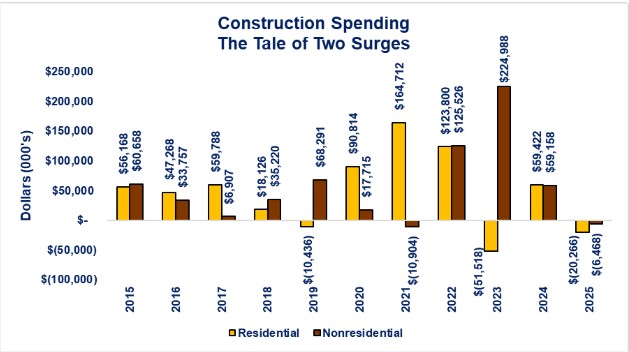
Since the nonresidential sector has the biggest percentage of total construction spending, let us dive into the details of the various sectors. The most striking subsector story is the huge surge in manufacturing construction.
There has been a lot of discussion about trying to bring manufacturing back to the US. What the construction spending data shows is that manufacturing construction is alive and well. Where the problem lies in the manufacturing industry is in jobs not in manufacturing output. We can see from the graph below that manufacturing construction was the major driver in the surge in total construction activity discussed above.
This is directly attributable to the fiscal stimulus CHIPS Act and Inflation Reduction Act. The CHIPS act spurred building for semiconductor fabrication with the stated goal of reducing or eliminating US dependence on Taiwan. The Inflation Reduction Act spurred building of manufacturing plants for EV batteries and solar panels. As manufacturing activity rose, the need for more power rose and power grid modernization and power capacity rose.
The question is whether the surge in activity is the start of a revitalization of manufacturing in the US. The decline in manufacturing construction in 2025 currently looks like a normalization process as discussed above with the total construction activity decline. The risk for a true revitalization is if the volatility of fiscal policy creates new uncertainty, then commitments to new factories may be curtailed.
The wild card is the changes that may result from the war with Iran. New US manufacturing to build new types of military weapons and defense systems to combat drones could provide another source of manufacturing in the US.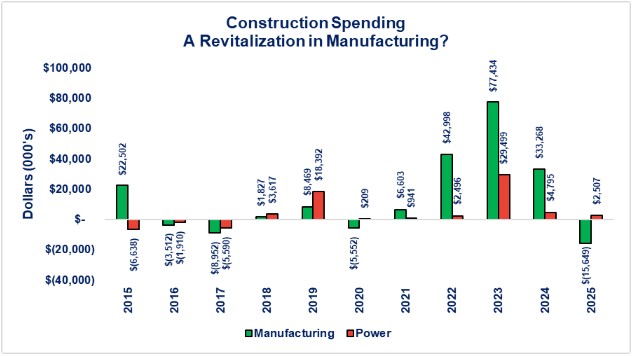
Another subsector that experienced the 2021-2023 surge effect was the Commercial subsector. Commercial construction includes retail and wholesale stores along with warehouses. The surge for Commercial comes from the switch from “just in time” inventory management before the pandemic crisis to “just in case” inventory management after the pandemic crisis. This created a surge in demand for warehouses to store the new inventory that was being kept onshore.
Once the new stocking of inventory was completed, year-over-year growth turned negative. The other interesting story included in the graph below is the stability of Office construction. Given all the press of the problems in the office space of commercial real estate, you might question why new construction would continue. The not so intuitive answer is that the Census Bureau classifies data centers in the Office subsector.
This is what provided the growth from 2022 forward even though the rise in interest rates that started in 2022 negatively impacted what we might traditionally think of as office space.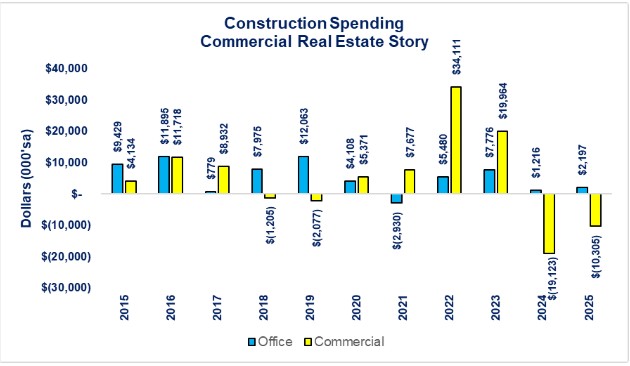
The last subsector to review is Healthcare construction. This is the only subsector that has not had a negative growth year over the past decade. True, 2025 was barely positive but it was still positive while total construction spending growth was negative.
The story for the Healthcare subsector was different from the other surges discussed above. There were several drivers of the growth.
-
Pent up demand from projects that were deferred during the pandemic crisis,
-
Future expansion projects being pulled forward due to concerns over rapidly rising inflation,
-
The pandemic crisis exposed capacity shortfalls for acute care facilities and spurred demand for new facilities.
-
According to an article from Healthcare Financial Management, the percentage of respondents surveyed about their plans for acute care hospital projects in the next three years rose from 16% in 2019 to 34% in 2022.
-
-
The shift to outpatient and distributed care models created demand for outpatient surgery centers, clinics, labs, and micro hospitals distributed among communities.
As those projects were completed, year-over-year growth slowed.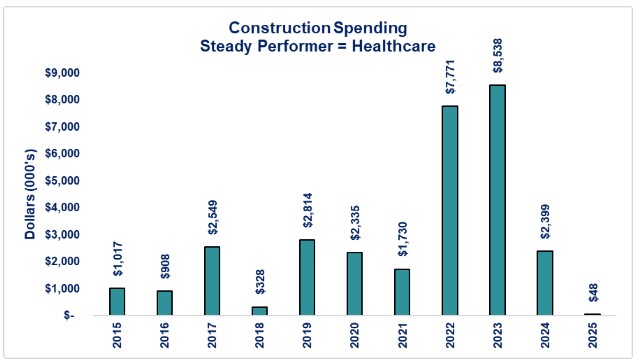
Conclusions
-
Although total construction spending declined 1.2% in 2025, we should be cautious about jumping to any conclusions that the construction industry is in trouble. This may be more of a normalization from a boom that could not be maintained.
-
The caveats to the macro picture is that the story at the state level may be different from the overall macro picture.
-
-
Construction spending may be entering a two-speed market where federally supported infrastructure projects like highways, power, and water remain steady but interest-rate sensitive sectors (i.e., residential) and fiscal stimulus projects continue to slow.
-
The open question for 2026 is whether war driven supply chain issues and potential new tariff headwinds bring an end to the Industrial Supercycle of the manufacturing sector or spur new types of manufacturing.
-
The aging US population points to continued demand for health care services. We have continued to see the Health Care & Social Services industry leading the nation for jobs growth. This implies that demand for the health care construction sector should remain positive. What appears to be changing is the type of health care construction (i.e., hospitals versus health care offices, labs, and outpatient services).
-
The one lesson that seems clear from the data is that when a sector has a surge in growth, it will be followed by a slowing and potentially a decline in growth as the surge pace cannot be maintained.
Disclosures

Steve is the Economist for Washington Trust Bank and holds a Chartered Financial Analyst® designation with over 40 years of economic and financial markets experience.
Throughout the Pacific Northwest, Steve is a well-known speaker on the economic conditions and the world financial markets. He also actively participates on committees within the bank to help design strategies and policies related to bank-owned investments.