


Economic Summary
It was another steady week of economic data releases. The results provided a mix picture of the health of the economy.
Housing
Existing home sales showed the impact of the spike in mortgage rates in March as interest rates responded negatively to the start of the war and the surge in energy prices. Existing home sales fell 3.6% year-over-year. April's housing data is a little more encouraging. Last week, the average 30-year mortgage rate fell from 6.5% to 6.42%. This resulted in mortgage applications rising 1.8% after falling 0.8% the week before. The increase was driven by refinancing applications as they are more sensitive to changes in mortgage rates. Applications to refinance rose 5.1% while applications to purchase fell 1.0%.
Inflation
Producers experienced a rise in inflation like consumers did with the Consumer Price Index. For producers, the Producer Price Index (PPPI) rose 4.0% year-over-year in March. Core PPI rose 3.8%, which was unchanged from February. US exporters benefited from a rise in prices of goods that they export. Export prices rose 5.6% year-over-year in March compared to 3.5% in February. US imports felt the pain of further price increases as import prices rose 2.1% compared to 1.3% in February.
Jobs
Initial jobless claims fell 11,000 last week to a total of 218,000. Continuing claims continued to rise as they rose 31,000 to 1,832,000. Companies may not have increased the pace of layoffs, but once you are laid off it is taking longer to find new work.
Manufacturing
The New York Federal Reserve reported an increase in its Empire State Manufacturing Index in April. The index rose from -0.2 in March to +11.0 in April. Not to be outdone, the Philadelphia Federal Reserve reported its manufacturing index increased from +18.1 in March to +26.7 in April. The Federal Reserve reported a slowing in industrial production but still growth. Its Industrial Production Index rose 0.7% in March compared to 1.2% in February.
Small Business Optimism
Optimism for small businesses fell in March as the Small Business Optimism Index fell from 98.8 in February to 95.8 in March. The Uncertainty sub-index rose from 88 in February to 92 in March and small business owners reported that taxes were their biggest challenge. Inflation was the second biggest challenge.
Perspectives
Soundbite
Of the 212 items tracked, 106 experienced an increase in March compared to February, 9 had no increase, and 97 experienced a decrease. That is more balanced than what the headlines would imply.
As has been discussed in previous Perspectives, consumers are not necessarily experiencing the same level of inflation as the official Consumer Price Index (CPI) report shows and it is likely-given the data on the individual items-consumers are probably experiencing a higher inflation rate compared to the official result.
Analysis
The Bureau of Labor Statistics (BLS) provides a detail breakdown of inflation beyond what is reported in the news stories. Examining inflation at the most detailed level results in 212 items that had 12-month data for both February and March. This matters because the detailed items show different results than the high level results. An example is gasoline. Just examining “gasoline” gives one inflation number. As we all know, gasoline comes in three different grades (regular, mid, and premium) with different prices for each. What many people may not realize is that prices for regular gas have risen faster than mid or premium between February and March.
This week's graphs will highlight the top and bottom 10% of the 212 items to let us see the extremes at both ends. Let us begin with February's data. Coffee experienced the highest 12-month inflation rate and instant coffee (do people still drink that??) rose the most at a 27.0% 12-month increase. Even though the Federal Reserve excludes food and energy when making interest rate decisions, most consumers care a lot about food and energy. What stands out about the top 10% for highest inflation is that 10 out of the 21 items in the top 10% are food items. In February only one energy item was in the top 10%. That was Utility (piped) gas service (i.e., natural gas) at 10.9%. For those curious, the BLS classifies all beverages (including coffee) in the major category of “Food.” Candy and chewing gum are also considered food. For those who love data, 168 out of the 212 items experienced some level of inflation. There were 16 items that experienced double-digit 12-month inflation. Not everything experienced a price increase. There were 44 items that experienced price declines and 3 that experienced double-digit price declines. For all of you who experienced the surge in egg prices last year thanks to the avian flu problem, you will be happy to learn that egg prices fell 42.1% over the last 12 months (as of February). Gasoline prices all declined in February between a 3.3% decline for premium to a 6.1% decline for regular gasoline.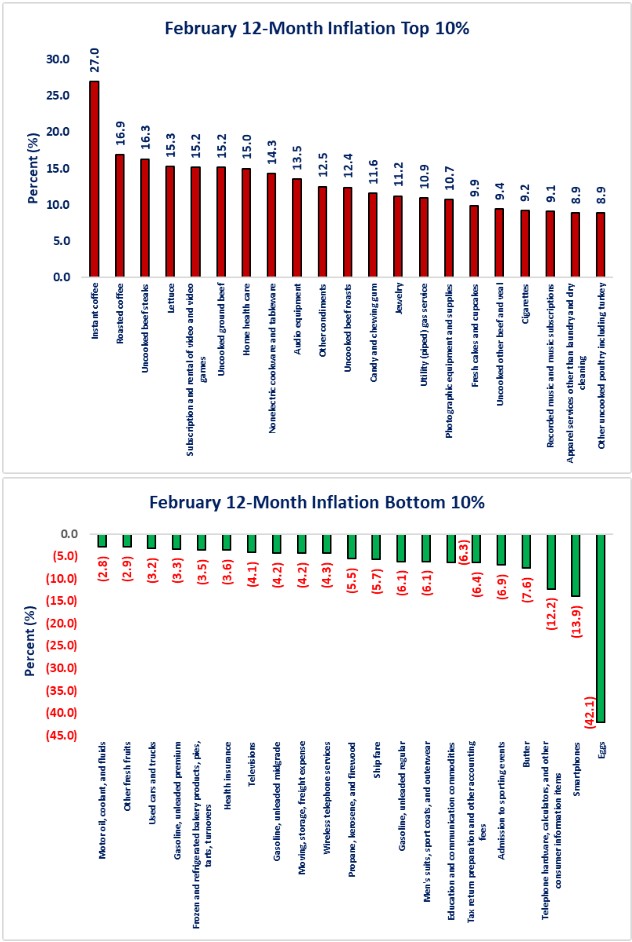
If we fast forward one month to March's results, we can clearly see the impact of the war on Iran as it relates to energy. The biggest change is that energy prices went from being in the bottom 10% in February to the top 10% in March. What may be surprising to many is that, although energy items occupied 5 of the top 10% items for 12-month inflation rates, food had more items in the top 10% for price increases. Food items accounted for 9 out of the 22 items. Overall, there were more items with positive price increases compared to February. March had 173 out of the 212 with price increases. More items experienced double-digit 12-month prices increases as well. There were 22 items compared to 16 items in February.
On the good news side, there were 36 items that experienced a 12-month price decline. The number of items with double-digit price declines increased from 3 in February to 5 in March. Eggs remained the leader with a 44.7% 12-month decline. As a caution, that does not mean that eggs fell an additional 44.7% on top of February's 42.1% decline. It means that when the February 2025 data dropped from the 12-month calculation and March 2026 was added, the March 12-month change dropped a little further compared to February. As each month progresses and the high 2025 levels drop off, the 12-month change will become smaller, all else being equal. One item that is interesting to note-even though it did not make the top 10%-is the 12-month inflation for delivery services. Its 12-month inflation rate rose from 7.1% in February to 9.8% in March. With many people now using delivery services for many of their purchases (Amazon, Walmart, Door Dash, etc.), demand may be a factor as well as the rise in fuel costs. What will be interesting to watch is if consumers will cut back on delivery services if prices continue to rise or if delivery services have now become a “core” expense for some households given their busy work and kids activities schedules.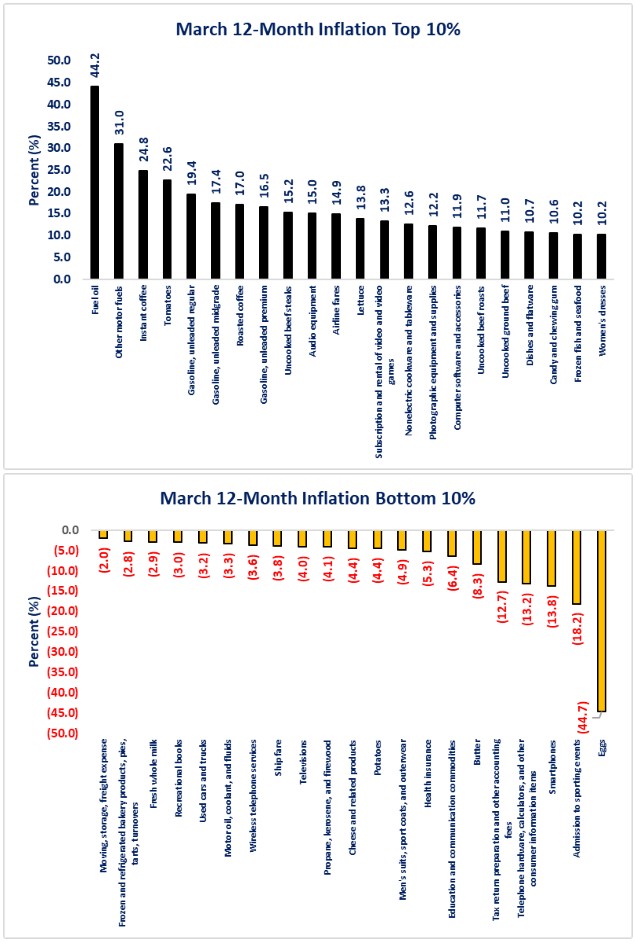
We have examined the level of inflation for February and March, now let us examine the magnitude of the change. What the chart below shows is the impact of the war on energy prices. Energy items made up 5 of the 24 top 10% items and were also the top 5 of the 10%. The magnitude of the change between months for the energy items ranges between 19.8 percentage points for premium gasoline to 38.0 percentage points for fuel oil. For someone who heats their house with fuel oil that is a huge impact. Unfortunately, that increase may well be hitting the elderly and low-income households the hardest since homes using oil for heat are the older homes where an elderly person or a low-income household may live. They may not to be able to afford to convert to electricity or natural gas heat. Overall, 106 items experienced some level of positive change in the 12-month inflation rate while 9 experienced no change. What is interesting is that, when it comes to the magnitude of change, three categories accounted for 12 out of the 23 items in the top 10%. Energy accounted for 5 out of the 23 apparel accounted for 4 and food accounted for 3 out of 23.
Examining items where the change was negative reveals that there were 97 items that had a lower 12-month inflation rate in March compared to February. From that perspective, there was close to an even balance for items that experienced an increase in the 12-month inflation rate in March compared to February and items that experienced a decrease or no change. 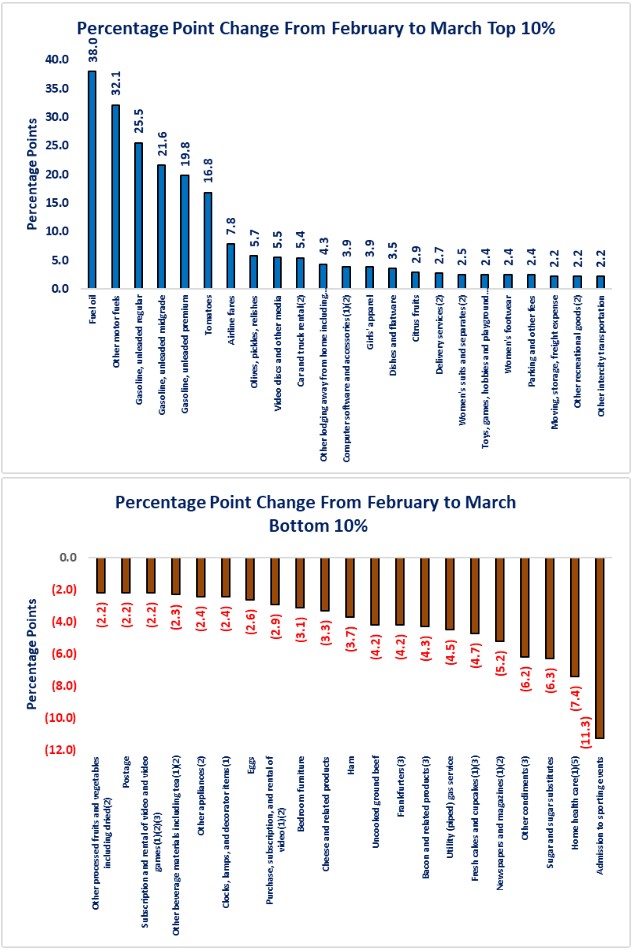
Finally, I put together a non-scientific (more like “back of the envelope”) group of items that most likely impact the average consumer. The goal is to highlight items that most likely impact consumers. This at least gives you a picture of the 12-month inflation rate for these items. Whether some or all these items apply to you is unique for each reader.
What the graph shows is that 19 out of the 29 items had 12-month inflation rates above 3.0% and 23 out of the 20 had a 12-month inflation rate above the Federal Reserve's 2.0% target. Only 2 items had a 12-month inflation rate that declined. Just looking at the chart would indicate that it is very likely that the average consumer is experiencing a 12-month inflation rate that is higher than the official 3.3% level.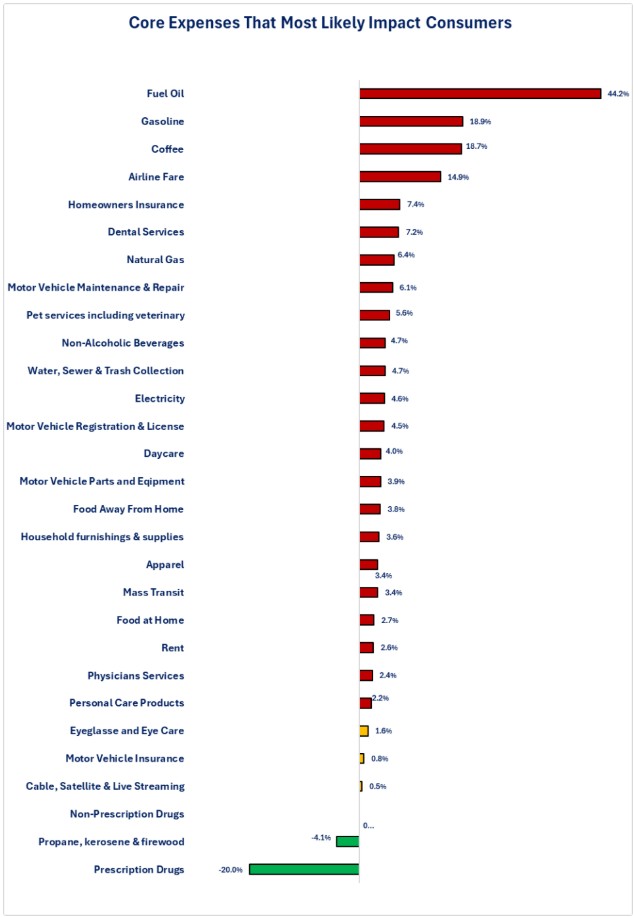
Conclusions
-
The March inflation data indicates that, after a month of war (the war started 2/28/26), the impact appears to have only been transmitted through to energy prices so far.
-
Recognize that oil and its derivatives flow through to a wide variety of products, so it may take longer for the impact to be transmitted through to the final price of these items.
-
-
Despite the headline news of skyrocketing energy prices, the March data on 12-month inflation was close to being in balance since 106 items experienced an increase in the 12-month inflation rate compared to February while 97 experienced price decreases and 9 had no changes.
-
Based on the data on the 212 items, the consumer may be experiencing a higher inflation rate than the official CPI rate of 3.3%.
Note:
There are clearly flaws in both the process of collecting the official data to calculate inflation as well as the weightings assigned to get the final result. With advances in technology, there must a better way to calculate inflation. Unfortunately, given our current budget situation in the US, the Bureau of Labor Statistics is suffering budget cuts and staff reductions, not new investments in technology to improve the process and the accuracy of the results. Even with these issues, the data gives us a consistent set of data to understand the direction of inflation. It is quite likely that your experience with inflation does not match the official data, but the direction of your inflation experience most likely does.

Steve is the Economist for Washington Trust Bank and holds a Chartered Financial Analyst® designation with over 40 years of economic and financial markets experience.
Throughout the Pacific Northwest, Steve is a well-known speaker on the economic conditions and the world financial markets. He also actively participates on committees within the bank to help design strategies and policies related to bank-owned investments.