


Economic Summary
Consumer Sentiment
The University of Michigan released the preliminary results of the February Consumer Sentiment index. The preliminary results show the consumer became slightly more optimistic compared to January. The Consumer Sentiment Index rose from 56.4 in January to 57.3 in February. The Current Conditions sub-index rose from 55.4 to 58.3 while the Future Expectations sub-index fell from 57.0 to 56.6.
Employment
ADP released its version of the national nonfarm payroll report. The results continued to show a “low hire” environment as the report showed a 22,000 increase in jobs in January. ADP also revised December's results down from 44,000 to 27,000.
The Department of Labor reported a 22,000 increase in filings for initial jobless claims. Initial claims were 231,000, which remains within the 200,000 to 250,000 range that has existed since 2023. Continuing claims rose 25,000 to 1,844,000.
The Challenger layoff announcement report showed a 117.8% increase in the number of announced layoffs compared to last January. As a reminder, these are layoffs announced not actual layoffs.
The Bureau of Labor Statistics reported a 386,000 drop in job openings in December. The number of people quitting their jobs fell by 78,000 and the number of new hires rose 172,000 compared to November.
Housing
Mortgage applications fell 8.9% last week with applications to purchase falling 14.4% and applications to refinance falling 4.7%. The Mortgage Banker Association reported that Winter Storm Fern was the driving force behind the declines.
Manufacturing Sector
Both manufacturing reports showed improvement, but the magnitude was different. S&P Global's manufacturing Purchasing Managers Index (PMI) rose from 51.9 in December to 52.4 in January. ISM's PMI rose from 47.4 in December to 52.1 in January. Anything above 50 indicates manufacturing activity is growing.
Service Sector
S&P Global reported a minor increase in its service sector PMI in February. The index rose from 52.5 in January to 52.7. ISM's Non-Manufacturing PMI showed no change as the index remained at 52.8.
Perspectives
Past newsletters have discussed the current “low hire, low fire" jobs environment. This week's Perspectives examines the other side of the jobs story: unemployment. The analysis examines unemployment by age.
Soundbite
When examining the unemployment rate by age, there is a clear rising trend in place for the youngest age group (16 to 17 years old) while the rest of the age groups show a mixed trend. When examining what percentage of total unemployment each age group makes up, the 25-to- 34-year age group has the largest percentage. The trend is rising for the two youngest age groups as they are slowly making up a growing percentage of the total unemployed.
The hotly debated question (with no clear answer yet) is: will the renewed focus on efficiency by businesses and the growing use of Artificial Intelligence to manage many tasks eliminate jobs that unemployed people would traditionally fill, or will it create jobs that can be filled by the unemployed through retraining, relocation or some other strategy?
Analysis
The government's definition of unemployment includes those people actively looking for a job during the four weeks leading up to the monthly survey period. This includes someone who was laid off, fired, quit, has restarted the job search process or is newly beginning the process of looking for a job. It does not include someone who has given up looking for a job but still wants a job.
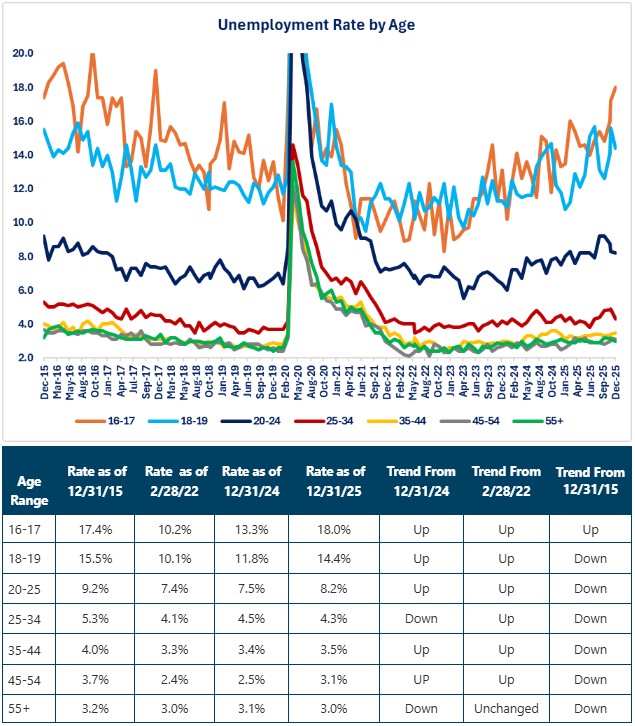
Since the official unemployment rate is what gets the media headline, let us start by examining trends for the unemployment rate by age. What the graph and the first table below show is that the younger you are, the higher the unemployment rate. Intuitively, this should not be surprising. Except for the rare exceptions, people between the age of 16 and 19 have not yet received the level of education or firsthand experience to qualify for many jobs. In addition, with the changes in the labor laws over the past decade as well as more states implementing minimum wage laws, business may be far less willing to hire a younger person with limited or no experience at the higher pay scale being dictated by the minimum wage laws and the restrictions imposed by labor laws.
Now, let us examine any trends that can be identified. The first table provided information on trends for three time periods.
-
One year (12/31/24 to 12/31/25)
-
Since the Federal Reserve started raising interest rates (2/28/22 to 12/31/25)
-
Ten years (12/31/15 to 12/31/25)
Several points stand out when examining the first table.
-
Five out of the seven age groups have a higher unemployment rate compared to a year ago.
-
All age groups except for the 55 and over group have higher unemployment rates now compared to when the Federal Reserve started to raise interest rates.
-
In an example of what is called “recency bias” many people may think that unemployment rates are high compared to history. This is because the rate is higher over recent time periods (1 year and 2.8 years). When examined over 10 years all age groups except one have unemployment rates that are lower.
-
The 16-to-17-year age groups have a rising trend over all time periods. The rest have mixed results.
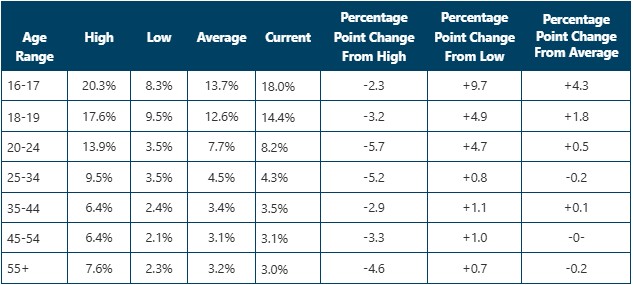
Rather than looking at trends for the unemployment rate, we can take an alternative view and examine how much each age group's unemployment rate changed over the same three periods. The table below shows the percentage point change for each age group versus the high, low, and average unemployment rate over the past ten years. What the table highlights are the following:
-
The 16-to-17-year age group has fared the worst. It is the age group that is closest to its high with a 2.3 percentage point decline from the high. It is the furthest from its low rate as it is 9.7 percentage points above its low. It is also the highest above its average as it is 4.3 percentage points above its average rate.
-
The 20-to-25-year age group showed the best improvement from its high over the past year as it is 5.7 percentage points below its high.
-
The 55 and over age group has the best results when measured against the low and the average. This age group is 0.7 percentage points above its low and 0.2 percentage points below its average. The 25-to-34-year age group was close behind as it was 0.8 percentage points above its low and 0.2 percentage points below its average rate.
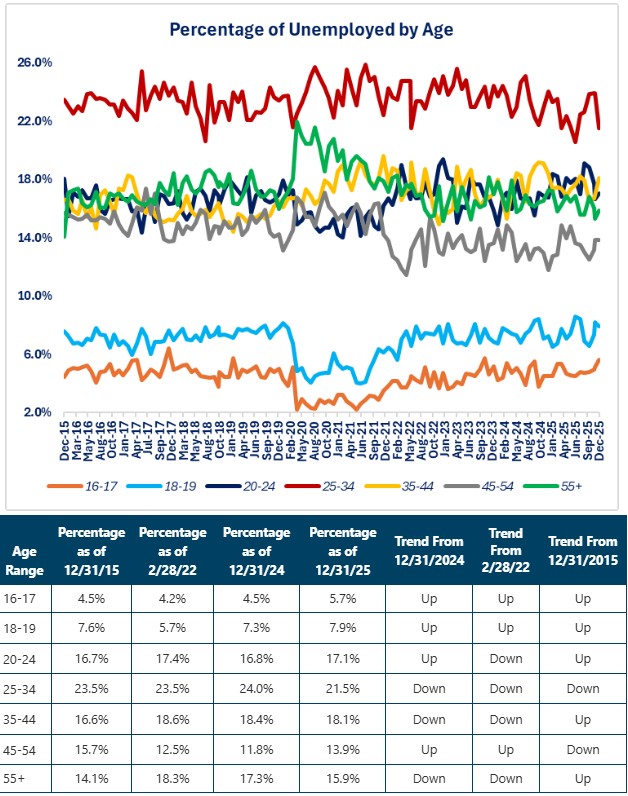
Another way to examine the country's unemployment situation is to look at what percentage each age group makes up of the total unemployed. This examines the number of people unemployed rather than the unemployment rate. This is important to help us understand the bifurcation or K shape of the unemployment situation.
The graph below highlights the following:
-
The 25-to-34-year age group makes up the highest percentage of unemployed people.
-
The 16-to-17-year age group makes up the lowest percentage.
-
Three age groups are clustered in the 16% to 18% range.
-
20-to-24
-
35-to-44
-
55 and over
-
-
The 16-to-17-year and 18-to-19-year age groups have clear rising trends as they are making up a rising percentage of the total for all three periods.
-
Even though the 25-to-34-year age group is the highest percentage of total unemployed for all periods, this age group has a clear declining trend over all periods.
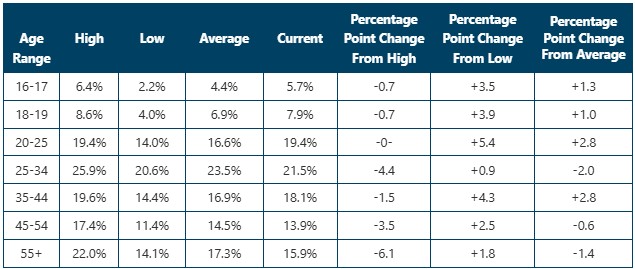
Now, let us examine the percentage point change the same way we did for the unemployment rate. Highlights from the table below are as follows.
-
The 55 and over age group had the biggest percentage point drop from its high as its percentage of total unemployed fell 6.1 percentage points.
-
The 20-to-25-year age group had the poorest performance as it is currently at its highest percentage of the total. It should come as no surprise that it is also the furthest from its low with a 5.4 percentage increase from its low.
-
The 25-to-34-year age group is the closest to its low as it is currently 0.9 percentage points above its low.
-
Two age groups experienced the biggest percentage point increase above their average. Both are 2.8 percentage points above their average.
-
20-to-24-year age group.
-
35-to-44-year age group.
-
-
The 55 and over age group had the biggest decline from its average with a 1.4 percentage point decline.
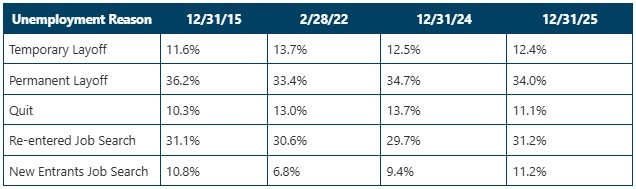
Finally, it is important to understand the reason for unemployment. There has been plenty of discussion over why the unemployment rate is rising while initial jobless claims remain within a range. That is because layoffs-which result in filings for unemployment benefits-are only one component of total unemployment. People who quit their jobs, are re-entering the job search process, or are a new entrant into the job search process are counted as unemployed but generally are not eligible for unemployment benefits. States manage unemployment benefits so there are some exceptions.
From an economic perspective, unemployment is an expense for the government for the unemployment benefits paid to people who qualify for unemployment benefits. As discussed above, unemployment benefits are only available for those people who are laid off. Understanding the trends in the composition of unemployment helps us understand the potential economic impact on this form of government spending.
Some of the highlights from the table below include:
-
The increase in unemployment has come from an increase in the percentage of people who have re-entered the search for a job or people who are looking for a job for the first time. The total of these two categories increased from 41.9% of the total as of 12/31/15 to 42.4% as of 12/31/25. These two categories have increased as a total percentage of unemployed as of 12/31/25 compared to all three previous periods. All else being equal, since these two categories do not qualify for unemployment benefits, the rise in the unemployment rate has not increased the cost to the government as much as if the ratio had remained unchanged or decreased.
-
The total of the two categories that do qualify for unemployment benefits (temporary and permanent layoffs) decreased from 47.8% as of 12/31/15 to 46.4% as of 12/31/25. The total of these two categories as a percentage of total unemployment has decreased as of 12/31/25 compared to the three previous time periods. All else being equal, this lowers the expense of unemployment benefits compared to if the percentages had remained unchanged or risen.
-
In a sign of the “low hire” environment, the percentage of people quitting their jobs fell from 13.7% as of 12/31/24 to 11.1% as of 12/31/24. This percentage is also lower than 2/28/22 but is higher than 12/31/15.
Conclusions
-
An important point that is highlighted by the data is that only focusing on the unemployment rate may miss underlying implications associated with the number of people unemployed. Even though the two younger age groups have the highest unemployment rates, the two combined make up a smaller percentage of the unemployed compared to all the other age groups. The fact that the 25-to-34-year age bracket makes up the largest percentage of unemployed has underlying implications to consider including but not limited to the following.
-
For industry sectors with labor shortages, perhaps this age group should be targeted to help fill the positions. That could come in a variety of forms including, but not limited to targeted marketing, in-house skills training programs, relocation assistance, etc.
-
Unhappiness from this age group could result in a change in voting for a politician or a political party that they believe will address their unemployment. Given how connected this age group is to social media, it is far easier for this age group to spread their message and potentially quickly create a groundswell of support. The power and influence of social media was shown during the last national election. Changes in political parties could have an impact on the economy depending on what new policies are put in place.
-
Although the Bureau of Labor Statistics (BLS) does not publish the reason for unemployment by age, the dynamic to consider is that if college graduates are making up a larger percentage of new entrants, they are not eligible for unemployment benefits and may become dissatisfied faster and open to the idea of a change in the government compared to someone who is receiving unemployment benefits while searching for a new job.
-
-
The unemployment data highlights the fact that the national number that is published by BLS and highlighted by the media is not homogenous across age groups.
- The hotly debated question (with no clear answer yet) is: will the renewed focus on efficiency by businesses and the growing use of Artificial Intelligence to manage many tasks eliminate jobs that unemployed people would traditionally fill, or will it create jobs that can be filled by the unemployed through retraining, relocation, or some other strategy?
Disclosures
All data for this week's Perspectives section came from the Bureau of Labor Statistics.

Steve is the Economist for Washington Trust Bank and holds a Chartered Financial Analyst® designation with over 40 years of economic and financial markets experience.
Throughout the Pacific Northwest, Steve is a well-known speaker on the economic conditions and the world financial markets. He also actively participates on committees within the bank to help design strategies and policies related to bank-owned investments.