


Economic Summary
Consumer Sentiment
Based on the University of Michigan survey, consumer sentiment improved slightly in February. Its Consumer Sentiment index rose from 56.4 in January to 56.6 in February. The Current Conditions sub-index rose from 55.4 to 56.6 while the Future Expectations sub-index fell from 57.0 to 56.6.
Economic Growth
Based on the initial estimate, the economy slowed significantly in the 4th quarter. The Bureau of Economic Analysis estimates the economy grew 1.4% on an annualized basis in the 4th quarter. For the full year, the economy grew 2.2%. This is the preliminary estimate with revisions that will be made in March and April. A large decline in government spending accounted for the slowing growth. Federal Government spending subtracted 1.15 percentage points from GDP.
Housing
Housing starts rose 6.2% in the month of December. The increase was driven by a 10.1% increase in multi-family starts. Single family starts rose 4.1%. Building permits rose 4.3%. All the increase was in multi-family permits as single-family permits fell 1.7% and multi-family permits rose 18.1%. Pending home sales experienced a 1.4% increase in January, which was a solid improvement over the 9.3% decline in December. New Home sales fell 1.7% in December after falling 8.8% in November.
Mortgage applications broke their losing streak as mortgage applications rose 2.8% last week. All the increase came from refinancing applications. Refinancing applications rose 7.1% while applications to purchase a home fell 2.7%. The average 30-year mortgage rate fell from 6.21% to 6.17%.
Inflation
The Federal Reserve's preferred inflation gauge delivered worse results than the more commonly followed Consumer Price Index (CPI). The Personal Consumption Expenditures (PCE) index rose 3.0% in 2025. This compared to a 2.4% increase in the CPI. Core PCE rose 2.9%.
Jobs
Initial jobless claims continue to show an economy that may have a slow pace of creating jobs but also has a slow pace of layoffs. Initial jobless claims fell by 23,000 last week. The problem is that once you are laid off, it remains difficult to find a job as evidenced by a 17,000 increase in people filing for continuing unemployment benefits.
Leading Index
The Conference Board's Leading Index fell again in December as the index fell 0.2%.
Manufacturing
Industrial production rose 2.4% on a year-over-year basis in January. In a sign of businesses increasing spending, production of business equipment rose 9.3%. Durable goods orders fell 1.4% in December but core durable goods order rose 0.9%.
The New York Federal Reserve's manufacturing activity index fell from 7.7 in January to 7.1 in February. The Philadelphia Federal Reserve's manufacturing activity index showed an opposite result as the index rose from 12.6 to 16.3. The S&P Global Manufacturing PMI fell from 52.4 in January to 51.2 in February.
Personal Income
Personal income rose 4.3% year-over-year in December. This was driven by strong increases in government transfer payments. Wages and salaries grew 3.8% while government transfer payments rose 8.9%.
Personal Spending
Personal spending continues to grow at a faster pace than personal income. Personal spending rose 5.1%. Interest payments rose the fastest as interest payments rose 5.3%.
Personal Savings
As a result of personal spending increasing faster than personal income the savings rate fell from 4.2% to 3.6%. The personal savings rate fell steadily in 2025 as it was 5.2% in the 1st quarter, 5.0% in the 2nd quarter, 4.2% in the 3rd quarter and 3.6% in the 4th quarter.
Service Sector Activity
The S&P Global Services PMI slowed from 52.7 in January to 52.3 in February.
Trade
The nation's trade balance showed a deficit that increased by $17.3 billion. Exports fell by $5 billion while imports rose by $12.3 billion.
Perspectives
Soundbite
The trend for delinquencies has been rising for both auto and credit card debt. It should not be surprising that the Subprime category is experiencing the highest delinquency rates. What is surprising is how the Subprime auto category has seen the biggest deterioration since the end of the pandemic crisis. The Subprime category for auto loans accounts for almost 79% of total auto loan delinquencies and almost 62% of total credit card delinquencies. Examining the delinquency trends for the two major discretionary debt types reveals another example of the bifurcation in the economy.
Analysis
The Federal Reserve classifies a loan as delinquent if it is 30 days or more past due in its payment. For both types of debt, the credit rating agencies break out borrowers into three categories: Subprime, Near Prime and Prime. From a credit score perspective these categories break down as follows:
-
Subprime: credit score below 620.
-
Near Prime: credit score between 620 and 719
-
Prime: credit score above 719.
Let us start by examining trends for the Subprime category of borrower. As the chart below illustrates, since the end of the pandemic recession, the trend has been rising for both auto and credit card debt. The deterioration has been worse for auto loans compared to credit cards as the current delinquency rate for auto loans is above the peak levels of the past three recessions. Credit card delinquencies are above the peak level of the pandemic recession but below the Great Financial Crisis and Dot.com recessions.
If we are trying to examine delinquency rates as a potential precursor to recessions, we need to examine levels that existed one quarter before a recession starts. Peaks occur after a recession starts, so the table below highlights where the delinquency rates were one quarter before the past three recessions started. The Subprime auto category is at its highest level since the Federal Reserve starting tracking delinquencies. The overall story remains the same as the comparison made for peak levels. The Subprime auto category is above the levels that existed one quarter before the past three recession started, while the Subprime credit card category delinquency rate is above the levels that existed one quarter before the Pandemic and Dot.com recessions but below the Great Financial Crisis recession. What is also of interest is the fact that credit card delinquencies have historically been more volatile than auto loans. This makes sense since credit card debt is unsecured while auto debt is secured by the auto. As a result, credit card debt tends to show stress earlier and adjust faster, while auto loan delinquency shifts were more gradual. This has not been the case since the end of the pandemic crisis. We can see from the chart below that the amplitude (difference between peaks and valleys) was historically much smaller for auto loans compared to credit cards. This changed after the pandemic crisis as auto loan delinquencies have risen as much as credit card delinquencies. This is clearly an unusual pattern as there is currently almost no difference between the delinquency rate for auto loans versus credit cards. 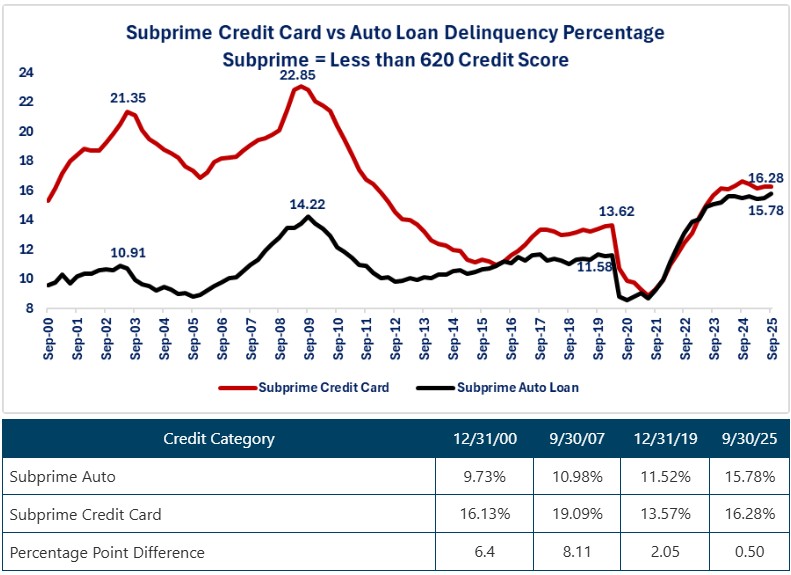
Now let us examine delinquency rates for the Near Prime category. Near Prime credit card delinquencies appear to have peaked and have started to turn lower while Near Prime auto delinquencies are still edging slightly higher. More importantly, both Near Prime auto and credit card delinquencies are above the peak levels from the two of the past three recessions and higher than the levels that existed one quarter before the start of each of the past three recessions. On pattern that is different than the Subprime categories are the percentage point difference between credit card and auto delinquencies widened since the pandemic crisis and is only recently narrowing because of the decline in credit card delinquencies. 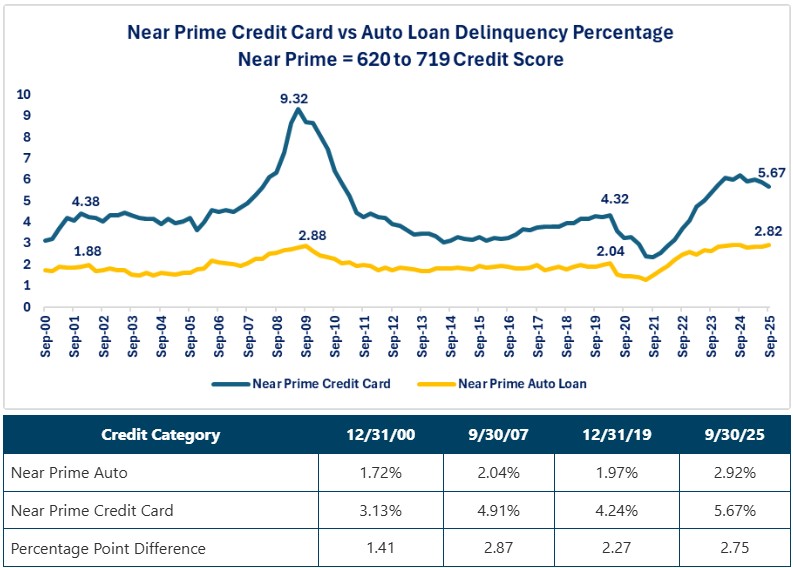
The final category to examine is the Prime category. This category has the lowest delinquency levels of the three categories. Even though the level is low, the current level for the Prime Auto and Prime Credit Card categories are above the levels that existed one quarter before the past three recessions. Both categories are also above the peak of two out of three of the past three recessions. The Prime Auto Category showed a different pattern than the Subprime and Near Prime Auto categories. Prime Auto delinquencies declined slightly in 2025. As a result, the percentage point difference between the Prime Auto versus Prime Credit Card categories widened. This is the widest differential since the Great Financial Crisis. This implies that Prime borrowers are prioritizing auto payments over credit card payments.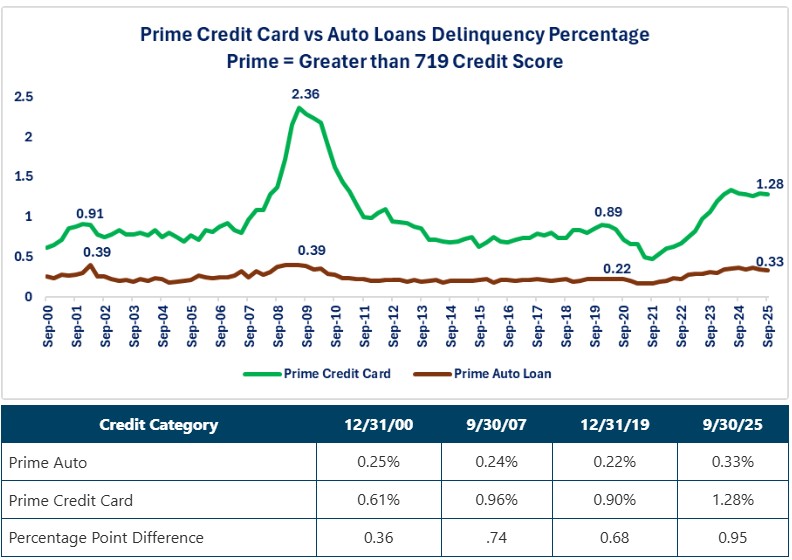
Conclusions
-
Based on the delinquency data, consumer financial stress has risen but not dramatically. Although the trend has been rising for delinquency rates , it remains below peak levels that occurred after the Great Financial Crisis recession.
-
The area of concern is the Subprime auto category. Since the end of the pandemic crisis, it has risen faster than the Subprime credit card category. Historically, the delinquency rate for credit cards is substantially higher than auto loans since credit card debt is unsecured debt versus auto debt being collateralized with the auto. Due to the faster rise in the Subprime auto category, there is only a 0.50% difference between the two rates now. There is no reason provided in the Federal Reserve reports, but the implication may be that Subprime consumers want to keep their credit cards available as an emergency line of credit and are choosing to let their auto loans go past due first.
-
The delinquency data provides another example of the bifurcation in this part of the economy. Currently the Subprime category accounts for almost 79% of total auto loan delinquencies and 62% of total credit card delinquencies. In comparison, the Prime category accounts for almost 5% of total auto loan delinquencies and 14% of total credit card delinquencies.
-
Even though current delinquency rates are above levels that existed one quarter before the start of the past three recessions, we cannot conclude that a recession is imminent. If there is one lesson that we have learned about the current economic cycle it is that it has consistently violated the trends and patterns that have existed in past economic cycles. Data that were reliable leading indicators of a recession in the past have failed in this economic cycle. Auto and credit card delinquencies appear to be another economic data set that is violating historical economic cycle patterns and providing no leading indication of a recession. The data does still give us insight into the financial health of the consumer.
Disclosures
This week's data was sourced from the Federal Reserve.

Steve is the Economist for Washington Trust Bank and holds a Chartered Financial Analyst® designation with over 40 years of economic and financial markets experience.
Throughout the Pacific Northwest, Steve is a well-known speaker on the economic conditions and the world financial markets. He also actively participates on committees within the bank to help design strategies and policies related to bank-owned investments.