


Economic Summary
Consumer Confidence
The Conference Board reported an increase in its Consumer Confidence Index from 89.0 in January to 91.2 in February. Consumers expressed growing confidence that jobs would become more available.
Construction
Construction spending rose 0.3% in December but is down 0.4% on a year-over-year basis.
Housing
FHFA reported a 1.8% increase in home prices in December while Case/Shiller reported a 1.4% increase. Overall, home prices continue to rise but at a slower pace than last year.
The Mortgage Bankers Association reported a 0.4% increase in mortgage applications. Similar to last week, the whole increase came from an increase in applications to refinance. Applications to refinance rose 4.1% while applications to buy a house fell 4.7%.
Inflation
Prices for businesses as represented by the Producer Price Index (PPI) remained stubbornly high. The PPI rose 2.9% year-over-year in January. This was a slight improvement from the 3.0% pace in December. Core PPI moved higher as it rose 3.6% after rising 3.3% in December. The question remains how much of that increase is passed through to the consumer.
Jobs
We continue to see a “low fire” jobs environment as the Department of Labor reported a small increase in the number of people filing for initial unemployment benefits, Initial Jobless Claims rose 4,000 last week to 218,000. Continuing claims fell 31,000 to 1,833,000.
Manufacturing
Factory orders fell 0.7% in December. Excluding the volatile transportation sector, core factory orders rose 0.4%. The Richmond Federal Reserve manufacturing activity index deteriorated further in February as the index fell from -6 in January to -10 in February. The Richmond Federal Reserve manufacturing activity index provided good news as the index rose from -2 in January to +10 in February.
Service Sector Activity
The Richmond Federal Reserve service sector activity index also deteriorated as the index fell from -3 in January to -8 in February.
Perspectives
Soundbite
Although the trend for charge-offs has been rising since the Federal Reserve started raising interest rates in 2022, the current levels are just normalizing back to the historical average. The post-pandemic lows were artificially suppressed due to stimulus checks, and moratoriums on rent and mortgage payments. This allowed the consumer to pay down their credit card balance or bring their payments current. The charge-off data tells a cyclical story with variations between consumer loan types. This category is a late-cycle stress indicator for the consumer, but it is not a leading indicator for a recession. The Credit Card charge-off category behaves as a lagging indicator for the economy as the peak happens after a recession is in progress. The Other Consumer Loans charge-off category moves in the same direction as the Credit Card category, but with less amplitude (i.e., lower highs and lows), and single-family mortgage charge-offs remain the outlier-quiet for most of the last decade and a half, except for the Global Financial Crisis (GFC).
Analysis
The Federal Reserve defines a charge-off as a loan that has become uncollectible resulting in the financial institution removing the loan from its books and charging off the outstanding balance against loan loss reserves or earnings.
For charge-offs, the Federal Reserve does not break down the data by credit category and uses broader loan categories. As a result, we cannot directly compare the trends to the delinquency trends. Foreclosure data breaks out credit card charge-offs but not auto. Instead, it has a broad category called Other Consumer Loans. This includes auto loans, student loans, loans for medical expenses, loans for vacations, and loans for personal expenditures.
Let us start by examining the trends for consumer loans. The graph and table below illustrate the Credit Card category is the most volatile and cyclical category of consumer loans when it comes to charge-offs. This can be seen from the following facts:
-
The peak occurred in June of 2010 during the GFC at 10.97%.
-
The post-pandemic low was in December of 2021 at 1.57%.
-
The recent peak was in May of 2024 at 4.73%
-
The latest level as of September 2025 is 3.92%.
Two things stand out when examining the data.
- The post-pandemic rebound that occurred when the Federal Reserve began raising interest rates was dramatic in terms of levels. From the Dec-21 trough (1.57%) to the May-24 high (4.73%), card charge-offs rose +3.16 percentage points. Keep. in mind that this was primarily an unwinding of the artificially compressed low that occurred during the post-pandemic recovery. Consumers received a combination of stimulus payments, rent, mortgage and student loan payment moratoriums. This allowed many consumers to pay down their credit card balances or correct delinquencies. Once the Federal Reserve started raising rates and the post-pandemic benefits expired, reality set in.
-
The rising momentum has cooled since mid-2024. The latest rate (3.92%) is 0.81 points below the May 2024 peak, suggesting a plateau rather than a straight-line deterioration. That is consistent with the idea that the system has normalized from an exceptionally benign 2020–2021 environment.
To put this in perspective, even though the trend has been rising since 2022, the current charge-off percentage is below the 2010-2019 expansion average of 4.29% and the 2000-2007 pre-Financial Crisis average of 4.98%. It is also significantly below the GFC recession high of 10.97% and below the long-term average of 4.52%.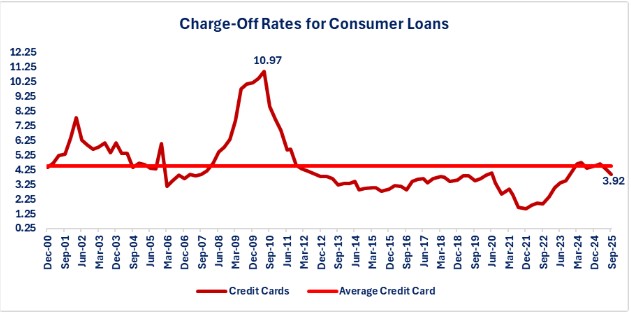
The next graph below shows that the Other Consumer Loans category appears to be trying to establish a peak from a rising trend that started when the Federal Reserve began raising interest rates. Perhaps it is entering a normalization level. The Other Consumer Loans category shows the same cycle pattern as the Credit Card category but with far less amplitude (i.e., lower highs and lows).
- The peak occurred June of 2009 during the GFC at 3.10%.
- The post pandemic low was in May of 2021 at 0.25%.
- The recent peak was in December of 2024 at 1.32%
- The latest level as of September 2025 is 1.16%.
One interesting fact worth noting is that since the normalization cycle started off the suppressed post-pandemic low of 0.25%, the charge-off rate has experienced a five-fold increase from the low to the high of 1.32%. That compares to a three-fold increase during the GFC. The level itself is nowhere close to the GFC charge-off level, but the change was much higher. This highlights how suppressed the charge-off level of 0.25% was due to the fiscal stimulus support to the consumer. Evidence that current levels have simply normalized can be seen in the fact that the current level is below the 2000-2007 average of 1.26%, above the 2010-2019 expansion average of 1.02% and slightly below the long-term average of 1.21%.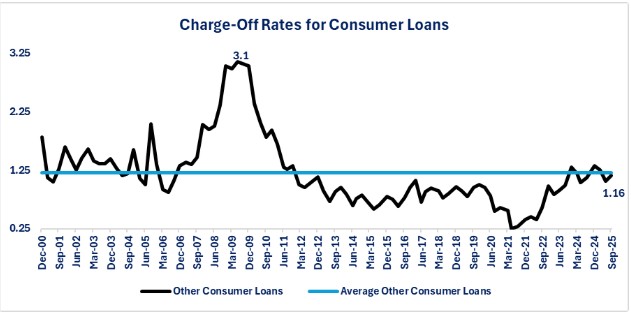
Finally, the graph below highlights that residential mortgage foreclosure rates are the outlier compared to other consumer loans. It is a far different situation for a household to default on their mortgage payment compared to their credit card, or other debt. The graph clearly shows that the GFC was an anomaly. Some of the facts on residential mortgage foreclosures include the following:
-
The peak foreclosure percentage was 2.78% and occurred in December of 2009.
-
The low was -0.05, which occurred in March and June of 2021.
-
The current level is -0.1 as of September 2025.
-
Since 2019 the foreclosure percentage has ranged between -0.05 to 0.01.
- The negative percentages are a reminder that charge-off rates can occasionally dip below zero due to recoveries, accounting reversals, or timing effects.
The major observation is that mortgage credit losses have been near zero for years, even as consumer credit has re-normalized. That resilience is consistent with structural fundamentals including strong home equity cushions in many mortgages, tighter post-GFC underwriting by financial institutions, and borrowers prioritizing shelter over discretionary credit.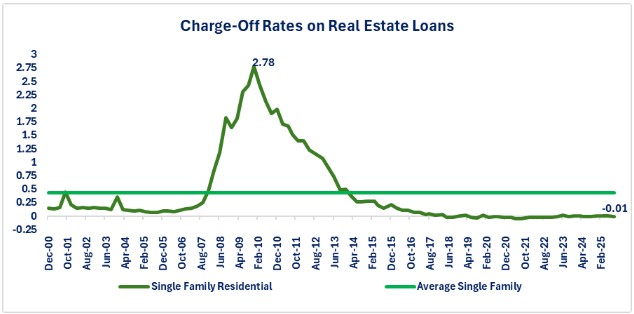
Conclusions
-
Overall, discretionary consumer loan charge-offs have gone through a normalization process since 2022 are back to historically normal levels.
-
The pattern of charge-offs varies by consumer loan type.
-
Unfortunately, since the data is not broken down by credit score categories, it does not reveal the bifurcation that exists beneath the surface of the totals. Based on what we learned about the differences in delinquency percentages by credit score, it is safe to say that this pattern also exists for charge-offs.
-
Credit cards are no longer “post-pandemic pristine.” Due to the fiscal stimulus provided to consumers during and after the pandemic crisis, credit card default rates were artificially suppressed. Now, they are behaving like a normal consumer credit product again: sensitive to income volatility, high APRs, and borrower liquidity.
-
The broad non-revolving consumer loan category (Other Consumer Loans) is softening, but it still looks more like “late-cycle normalization” than a “recession alarm.”
-
Mortgage credit performance is not driving the cycle right now; it is acting more like an anchor of stability.
-
It is important to recognize that this data does not give the complete picture of consumer charge-offs since it is data for financial institutions that are a member of the Federal Reserve. Even with that caveat, the data is still important in understanding of the charge-off rates for consumer loans.
Disclosures
All data for this week's Perspectives section came from the Federal Reserve's Charge-Off and Delinquency Rates at Commercial Banks database.

Steve is the Economist for Washington Trust Bank and holds a Chartered Financial Analyst® designation with over 40 years of economic and financial markets experience.
Throughout the Pacific Northwest, Steve is a well-known speaker on the economic conditions and the world financial markets. He also actively participates on committees within the bank to help design strategies and policies related to bank-owned investments.