


Economic Summary
It was another busy week of data releases. Overall, the message from the data releases is that the housing and manufacturing sectors continue to struggle, Businesses have become more productive but continue to show the pattern of low hiring and low firing. Despite the ongoing challenges of low hiring and the resulting struggle to find a job consumers became more optimistic to start the year.
Consumer Sentiment
Based on the preliminary January report from the University of Michigan, consumer sentiment improved in January. Perhaps the holiday season buoyed sentiment. Overall consumer sentiment rose from 52.9 to 54.0. This was driven by a solid rise in sentiment over current conditions. The Current Conditions sub-index rose from 50.4 to 52.4. The Future Expectation sub-index rose from 54.6 to 55.0.
Jobs
- The headline news for jobs this week was the release of the December employment situation report by the Bureau of Labor Statistics (BLS). The BLS reported a 50,000 increase in jobs creation in December and 4.4% unemployment rate.
- Separately, the BLS reported a decline in job openings in November. Job openings fell from 7,449,000 in October to 7,146,000 in November. This was a 14-month low. In a sign that employees may be worried about the ability to find a new job if they leave their current job, the number of quits fell by 188,000.
- The Department of Labor reported an 8,000 increase in initial jobless claims last week. Even with the increase, initial jobless claims were 208,000, which remains in the 200,000 to 250,000 range that has existed since the summer of 2023. Continued claims rose by 56,000 and continued to show a slow rise.
- ADP reported a 41,000 gain in nonfarm payrolls in December after a 29,000 decline in November.
- The Challenger layoff announcement report showed an 8.3% year-over-year increase in announced layoffs in December after declining 23.5% in November.
Housing
- The Mortgage Bankers Association reported a 0.3% increase in mortgage applications last week. This was an improvement over the 10% decline the week before.
- Applications to purchase a house fell 6.1% but applications to refinance rose 7.4%.
- The average 30-year mortgage rate fell from 6.32% to 6.25%.
- Applications to purchase a house fell 6.1% but applications to refinance rose 7.4%.
- Housing starts fell 4.6% in October after falling 9.1% in September. This is clearly not helping the housing shortage and affordability situation in the US.
- In a discouraging sign for potential future increases in housing inventory, building permits fell 0.2% in October after falling 2.3% in September.
Labor Costs
The BLS reported a 1.9% decline in unit labor costs in the 3rd quarter. This followed a 2.9% decline in the 2nd quarter.
Manufacturing
- ISM reported further contraction in the manufacturing sector as its manufacturing index fell from 48.2 to 47.9. A reading below 50 means activity is contracting.
- S&P Global also reported further deterioration in the manufacturing sector as its manufacturing index fell from 52.2 to 51.8. Its index remains in positive territory but is deteriorating.
- The Census Bureau reported a 1.3% decline in factory orders in October. This compared to a 0.2% increase in September.
Productivity
The BLS reported a 4.9% increase in nonfarm productivity in the 3rd quarter. This was stronger than the 4.1% increase in the 2nd quarter.
Trade
- The Census Bureau reported a solid decline in the nation's trade balance deficit as the trade balance fell from a $48.1 billion deficit in September to a $29.4 billion deficit in October.
- Imports fell from $342.1 billion to $331.4 billion.
- Exports rose from $289.3 billion to $302.0 billion.
- Imports fell from $342.1 billion to $331.4 billion.
Perspectives
Since we are starting a new year, I thought it would be good to gain perspective on how businesses finished 2025 since that is the base for starting 2026. The Census Bureau released the latest results of its Business Trends and Outlook Survey (BTOS) as of 12/28/25 so today's Perspectives section will examine how businesses rate their current performance based on the survey results.
Soundbite
To close out 2025, most businesses rated their current performance as average. The percentage of companies rating current performance as average ranged from a high of 59.6% for the Agriculture, Forestry, Fishing and Hunting industry sector to a low of 36.4% for the Utilities sector. Even though the Average was the highest overall result, beneath the surface weakening has occurred since the survey for this topic started (9/24/23). This was evidenced by a weakening in the Net Positive (Excellent plus Above Average) results and an increase in the Net Negative (Below Average plus Poor) results. When comparing 12/28/25 results to 9/24/23 results, 13 out of the 18 industry sectors experienced a decrease in the Net Positive results and 10 out of the 18 sectors experienced an increase in the Net Negative results.
It is important to remember that these survey results fall on the “soft” side of economic data as the results reflect each business owner's assessment of their company's current performance. They may reach their assessment by using a combination of hard data (i.e., financial results) and their own feelings. Whether this results in changes to their behavior in 2026 remains to be seen.
Analysis
The industry sector with the highest percentage of Net Positive results was the Utilities sector at 56.9%. The lowest was in the Accommodation & Food Services sector at 20.5%. When examining the percentage point change from 9/24/23 to 12/28/25, the sector with the strongest percentage point improvement was the Utilities sector at 9.4 percentage points. The industry sector with the biggest percentage point decline was the Agriculture, Forestry, Fishing and Hunting sector at a negative 11.1 percentage points.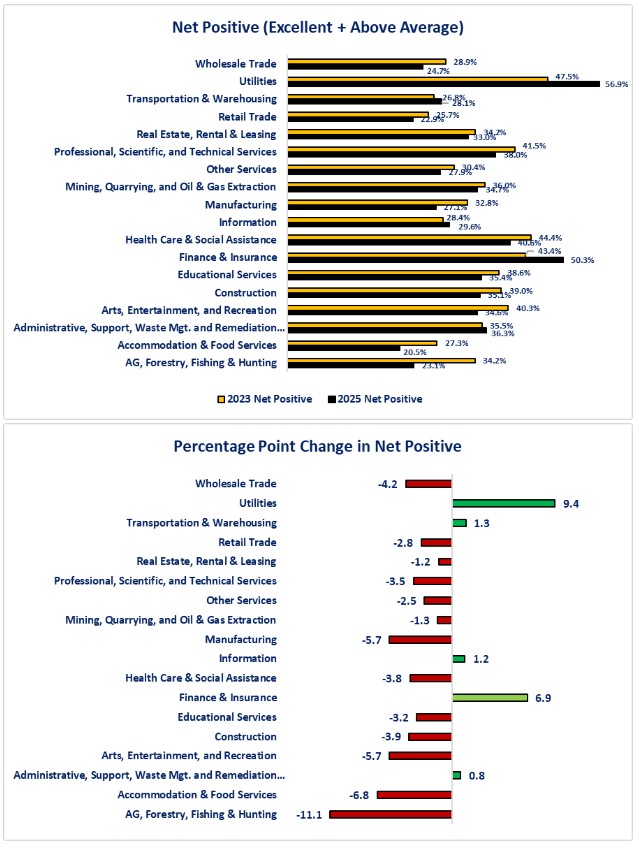
The Average category had the highest percentages for both 12/28/25 and 9/24/23. The Agriculture, Forestry, Fishing and Hunting industry sector had the highest percentage as of 12/28/25 at 59.6%. The lowest was the Finance & Insurance sector at 38.0%. There were 10 industry sectors that experienced an increase in the percentage of business owners rating their current performance as average. There were 8 that experienced a decrease. The Agriculture, Forestry, Fishing and Hunting industry sector had the biggest percentage point increase at 12.9 percentage points. The Minin, Quarrying, and Oil & Gas Extraction sector had the biggest decrease with a 12.7 percentage point decrease.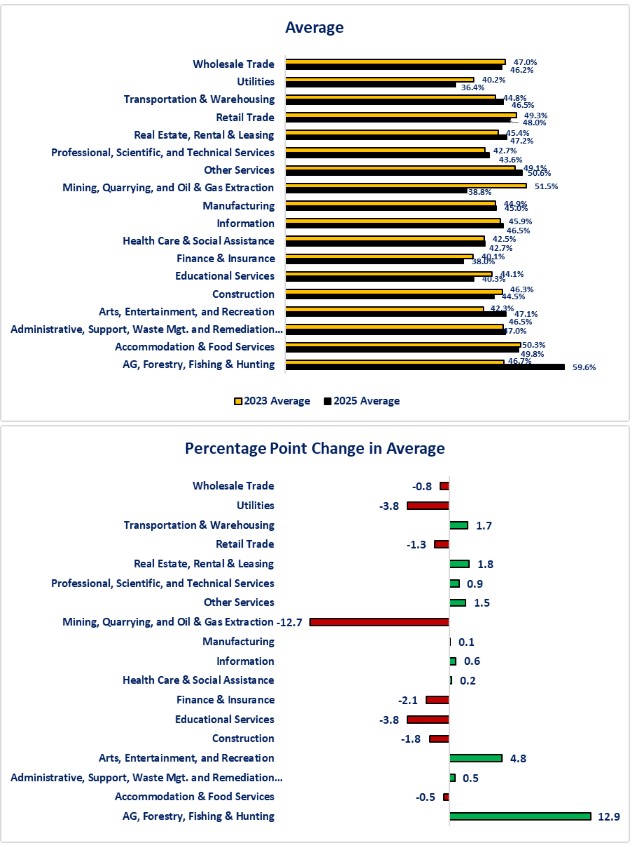
The Accommodation & Food Services industry sector had the Net Negative percentage at 29.7% while the Utilities sector had the lowest at 6.7%. Wehn examining the percentage point change since 9/24/23, 12 out of the 18 sectors experienced an increase in the percentage of business owners rating the current performance as poor compared to 9/24/23. Only eight sectors showed a decrease. The Accommodation & Food Services experienced the biggest percentage point increase since 9/24/23 at 7.4 percentage points. The Agriculture, Forestry, Fishing and Hunting sector saw the biggest improvement (decline) in the percentage of business owners rating their current performance as poor. In addition, 11 out of the 13 industry sectors, who experienced a decrease in Net Positive results, experienced an increase in Net Negative results. 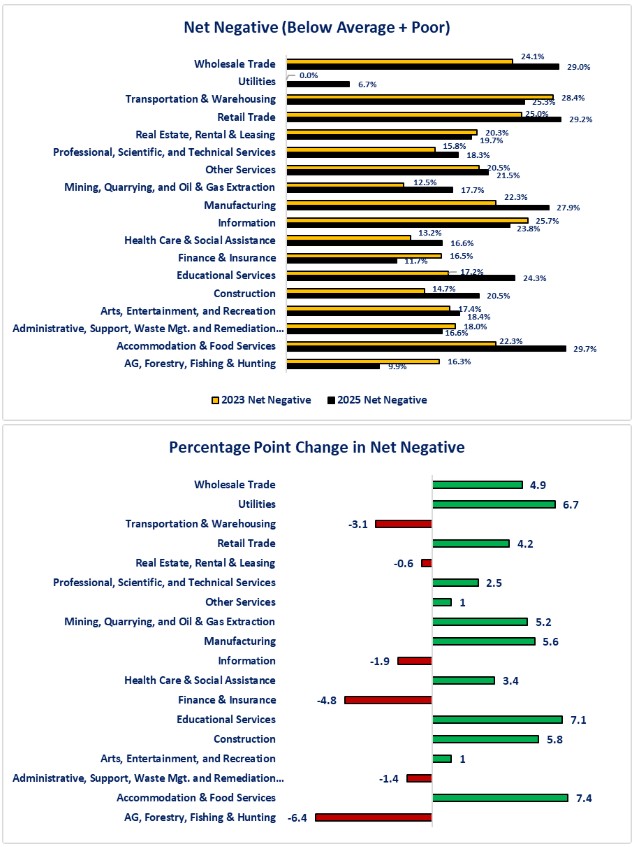
Conclusions
-
Overall, more business owners assessed their business' current performance as average but beneath the surface there is evidence of weakening as the Net Positive results declined and the Net Negative results increased.
-
The decline in Net Positive was due primarily to declines in the Better Than Average results and the increase in Net Negative was primarily due to declines in the Worse Than Average results. Changes to the Excellent and Poor results were more muted.
-
-
The four industry sectors that stood out as they were the only industry sectors that experienced both an increase in their Net Positive results and a decrease in their Net Negative results.
-
Administrative, Support, Waste Management & Remediation Services
-
Finance & Insurance
-
Information
-
Transportation & Warehousing
-
-
Bifurcation exists with these results like what we observe in other economic data. This simply re-emphasizes that the US economy is not a homogenous economy. It varies by state, but it also clearly varies by industry sector.
-
It is important to remember that these survey results fall on the “soft” side of economic data as the results reflect each business owner's assessment of their company's current performance. They may reach their assessment by using a combination of hard data (i.e., financial results) and their own feelings. Whether this results in changes to their behavior in 2026 remains to be seen.
Disclosures
Census Bureau Business Trends and Outlook Survey
Industry sectors used by the survey.
-
Agriculture, Forestry, Fishing & Hunting
-
Mining, Quarrying, and Oil & Extraction
-
Utilities
-
Construction
-
Manufacturing
-
Wholesale Trade
-
Retail Trade
-
Transportation & Warehousing
-
Information
-
Finance and Insurance
-
Real Estate and Rental & Leasing
-
Professional, Scientific, and Technical Services
-
Administrative, Support, Waste Management, and Remediation Services
-
Educational Services
-
Health Care & Social Assistance
-
Arts, Entertainment, and Recreation
-
Accommodation & Food Services
-
Other Services (Except Public Administration)

Steve is the Economist for Washington Trust Bank and holds a Chartered Financial Analyst® designation with over 40 years of economic and financial markets experience.
Throughout the Pacific Northwest, Steve is a well-known speaker on the economic conditions and the world financial markets. He also actively participates on committees within the bank to help design strategies and policies related to bank-owned investments.