


Economic Summary
It was another active week of economic data releases. What we learned was that the economic data improved in December and early January.
Housing
New home sales fell 0.1% in October but rose 18.7% on a year-over-year basis. The West region saw the biggest monthly decline at -36.3% while the South region experienced the biggest increase at +16.9%. The East region had the biggest year-over-year decline at -40.0% while the South had the highest year-over-year growth at +42.1%. The National Association of Realtors reported a 5.1% monthly increase in existing home sales in December. Mortgage applications surged last week thanks to a drop in mortgage rates. The average 30-year mortgage rate fell from 6.25% to 6.18%. This triggered a 28.5% surge in mortgage applications. Applications to buy a house rose 15.8% while applications to refinance rose 40.1%.
Inflation
The Consumer Price Index (CPI) finished 2025 with a 2.7% year-over-year increase. Core CPI rose 2.6%. For the major categories, Natural Gas prices rose the most with a 10.8% increase. The Gasoline and Airfare categories had the biggest decline at a -3.4% rate. Wholesale prices, as represented by the Producer Price Index (PPI), rose 3.0% year-over-year in November. Core PPI also rose 3.0%. Export prices rose 3.3% on a year-over-year basis in November while import prices were virtually flat at a 0.1% increase.
Jobs
The data still does not show evidence that the pace of layoffs is increasing. Initial jobless claims fell 9,000 last week as total initial claims fell below 200,000 to 198,000. For those filing continuing claims the total fell 19,000 to 1,884,000.
Manufacturing
Manufacturing activity in two of the Federal Reserve regions saw a rebound back into positive activity. The Philadelphia Federal Reserve manufacturing activity index rose from -8.8 to +12.6. The New York Federal Reserve manufacturing activity index rose from -3.9 to +7.7. The Industrial Production index increased 0.4% in December and the Manufacturing Production sub-index rose 0.2%.
Small Business Optimism
Small business optimism rose again from a reading of 99.0 in November to 99.5 in December. The biggest driver for the increase was an improved outlook for economic growth. The single most important problem for small businesses was taxes followed closely by a lack of qualified help.
Perspectives
Last Friday, we learned that the nation added 50,000 jobs in the month of December. That is clearly a slower pace than most of the year, but it is data for a month. Today's Perspectives section examines jobs growth by industry sector over the past 30 years to help gain perspective for both current results as well as how that compares to historical results.
Soundbite
Based on historical averages, the number of jobs created in 2025 was significantly slower than the annual average measured over 10, 20 and 30 years. Jobs growth last year was still positive but far slower. The Health Care & Social Services industry sector has been the dominant creator of jobs measured over all periods, while the Manufacturing sector has lost the most jobs over the last 30 years.
Analysis
Let us start by taking a very short-term view of job changes. What the graph below shows is that monthly jobs growth was very bifurcated in December as eight industries lost jobs, six industries added jobs and one industry was unchanged. The bottom three industries for jobs growth were Utilities (-33,000), Retail Trade (-25,000), and Construction (-11,000). The top three industries were Leisure & Hospitality (+47,000), Healthcare & Social Services (+38,000), and Government (+13,000). Total jobs growth was +50,000. The jobs data illustrates the “K” shape that many economists are now using to describe the economy. The six industries with jobs growth are the rising leg of the K and the eight industries with job losses are the declining leg of the K.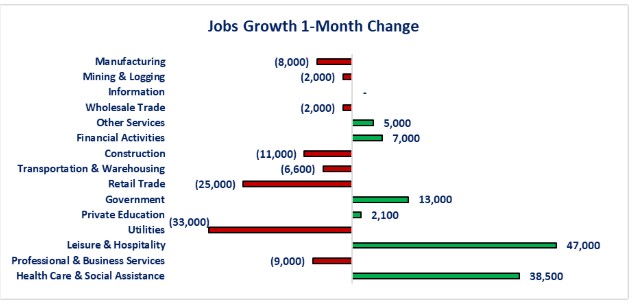
One-month jobs growth is a very limited view of the jobs market, so, let us zoom out a little and examine one-year jobs growth. Total jobs growth in 2025 was 584,000 jobs. The K shape was also present for the full year. For the full year, there were nine industry sectors that lost jobs and six that added jobs. You can see for the full year that the Health Care & Social Services industry dominated jobs growth while the Government sector had the biggest job losses. With the strong growth in the Health Care & Social Services sector, you might wonder what type of jobs are being. Digging deeper into the data shows, of the 712,600 jobs added in this sector, three sub-sectors accounted for 74% of total sector growth. The Individual & Family Social Services sub-sector accounted for 41% (289,000) of the sector's growth. The Hospitals sub-sector was second at 23% (163,500) and Offices of Physicians was third at 11% of the total (74,800).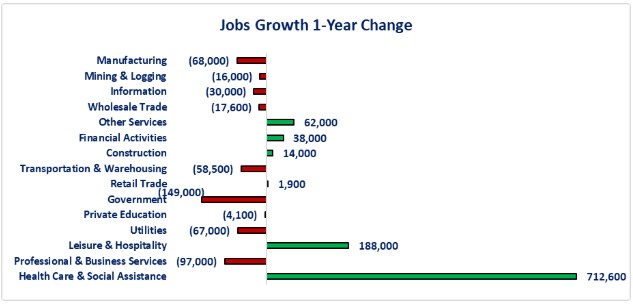
Now let us step back and examine ten-year growth. The US added 16,449,000 total jobs over the last ten years. That is an average of 1,644,900 jobs per year. That is over three times faster than 2025 pace. The graph below shows that all but two sectors (Mining & Logging and Retail Trade) had positive jobs growth over the past ten years. Once again, the Health Care & Social Services sector far outpaced the other industry sectors for total jobs growth. The Health Care & Social Services sector added double the number of jobs compared to the second fastest sector (Professional & Business Services). The three fastest growth sub-sectors within Health Care & Social Services were the same as the one-year period; only the percentages changed. The Individual & Family Services sector accounted for 30.1% of Health Care & Social Services jobs, Hospitals were 17.5% and Offices of Physicians were 12.3%.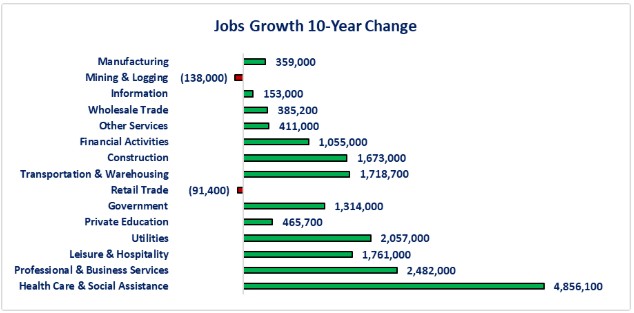
The macro picture is essentially the same when examining the 20-year period: most of the industries added jobs. Once again, the composition is slightly different as three industry sectors lost jobs (Manufacturing, Mining & Logging, and Information). The Health Care & Social Services and Professional & Business Services sectors continued to be the leaders in adding jobs. Most people think of Information as the Technology industry and may be a little puzzled that the Information sector has lost 138,000 over the past 20 years. The reality is that the Technology sub-sector of the Information sector only made up 11% of the sector 20 years ago but not makes up 23% of the sector. The job losses that have occurred over the past 20 years have happened in the Telecommunications sub-sector. Telecommunications lost 445,000 jobs over the past 20 years and its percentage of the Information sector has fallen from 34% in 2005 to 21% in 2025. The same three sub-sectors for Health Care & Social Services were the top job producers. The Individual & Family Service sub-sector accounted for 27.8% of total jobs added, the Hospital sector was 16.9% and the Offices of Physicians sector was 11.8%.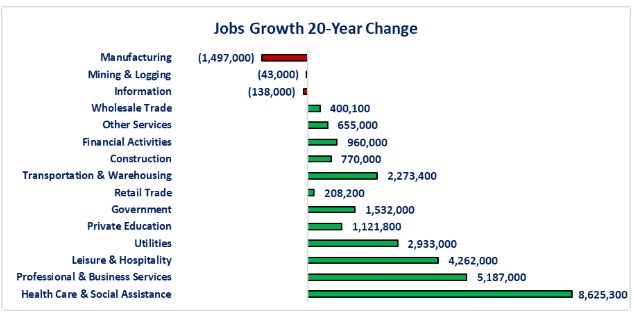
When viewed over 30 years, the bifurcation of jobs creation stands out between the Goods Producing industry sectors and the Service Providing sectors. Two out of the three Goods Producing sectors lost jobs while the top seven industry sectors for jobs creation are all in the Service Providing sectors. If we dive deeper into the top industry sector for job losses (Manufacturing) and job growth (Health Care & Social Service) we can gain perspective on what has happened beneath the surface.
For the Manufacturing sector there are 19 sub-sectors that the BLS tracks. Over the last 30 years, 17 out of the 19 sub-sectors experienced job losses. The top three sub-sectors for job losses were Computer & Electronic Products, Apparel, and Print & Related Support Activities. They accounted for 41% of total losses. Losses in the Computer & Electronic Products sector accounted for 16% of total losses. Apparel accounted for 15% and Printing & Related Support Services accounted for 10%. The two subsectors that had jobs gains were Food (+200,000) and Beverage, Tobacco & Leather Allied Products (+70,000).
Examining the Healthcare & Social Services subsectors reveals 16 out of the 17 subsectors have added jobs over the last 30 years. Vocational Rehabilitation Services was the only sub-sector with job losses at -17,300. The top three sub-sectors were the same as all other periods examined: Individual & Family Services (25.1%), Hospitals (17.1%) and Offices of Physicians (12.7%).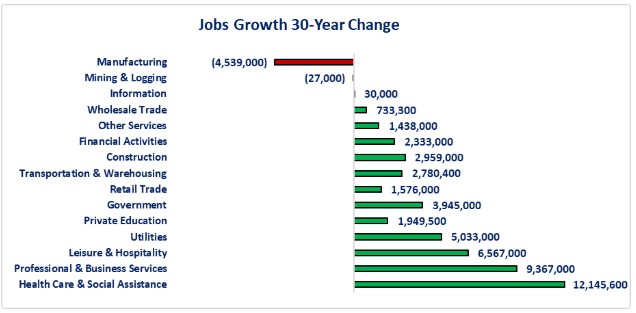
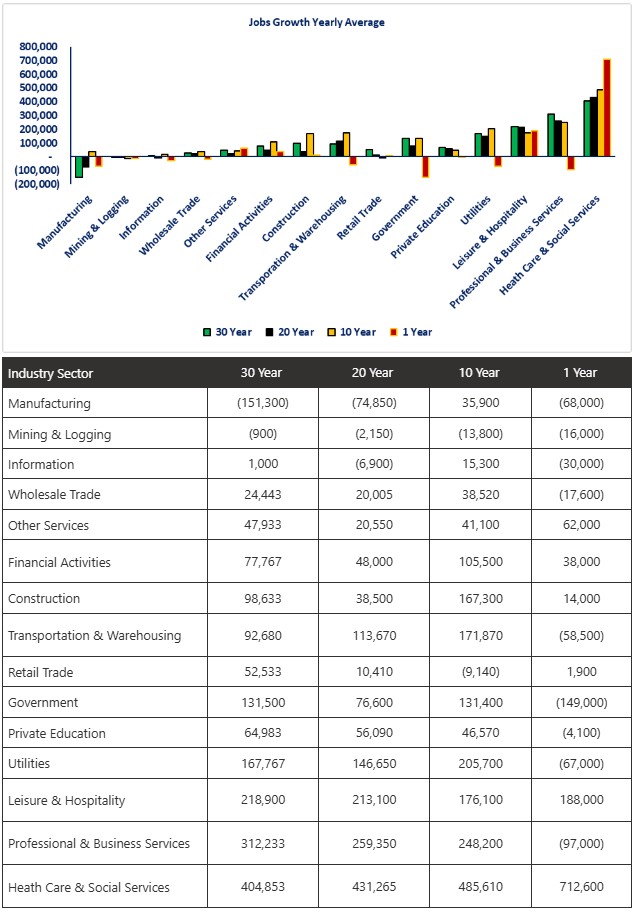
To evaluate each period on equal terms, we can calculate the yearly average to see if there are trends that become identifiable. What the graph and table below show is that the Health Care & Social Services industry sector has seen a clear rising trend for the yearly average jobs creation. Mining & Logging shows a clear trend of average yearly job losses increasing. The relatively good news for manufacturing is that the average job loss has been declining but, unfortunately, remains negative. We can also see that the past year was far weaker than the historical averages.
If we focus on the longer historical averages what we learn is:
-
Three industry sectors showed improving trends (i.e., average annual losses getting smaller or average gains getting bigger).
-
Manufacturing, Transportation & Warehousing, Health Care & Social Services.
-
-
Five showed deteriorating trends (i.e., average annual losses getting bigger or gains getting smaller).
-
Mining & Logging, Retail Trade, Education, Leisure & Hospitality, Professional & Business Services.
-
-
Seven were mixed with no clear trend.
-
Information, Wholesale Trade, Other Services, Financial Activities, Construction, Government and Utilities.
-
Conclusions
-
Examined over long periods (10, 20, and 30 years) the average annual jobs growth has ranged between 1,218,400 to 1,644,900 per year. Total jobs added in 2025 were significantly slower as 584,000 were added, and yet the economy continues to grow above 2% year-over-year.
-
The dominant creator of jobs is the Health Care & Social Services sector. This sector has been the top creator of jobs over all time periods examined. This sector has accounted for between 30% to 35% of total net job addition over the periods examined (10, 20, or 30 years). It accounted for over 100% of total net jobs created in 2025.
-
The Manufacturing sector has experienced the largest total job losses over the past 30 years while the Mining & Logging sector is the only sector that has experienced job losses for each of the time periods examined.
-
The jobs market shows bifurcation when industry sector jobs growth is examined. That is true going back 30 years. The difference is that there were only two to three industries with job losses over the past 30 years while 2025 had eight industry sectors with losses.
-
From a risk management standpoint, the one clear takeaway from the jobs data is that jobs growth is heavily concentrated in one industry sector. When one industry sector accounts for 30% or more of total jobs growth, that creates a real risk if anything happens to that industry sector.
-
The conundrum that is puzzling most economists is that jobs growth is historically low and yet the economy continues to show solid growth. The four scenarios that have received the most attention as a possible explanation for the slow jobs growth in a growing economy are the following.
-
The economy is weaker than what the macro data is showing and the jobs growth data is developing as a leading indicator of future economic problems.
-
This is a temporary situation where businesses were cautious to hire because of the high level of uncertainty that resulted from the new style of government communication and fiscal policy in 2025.
-
Businesses over-hired after the pandemic crisis ended and are now “right-sizing” back to levels that reflect current demand for their products and services.
-
This a start of a structural change in what is considered “normal” jobs growth. With the risk of a shrinking labor force due to retirements and restricted immigration, rising raw material costs, and increased compliance costs (especially related to tariffs), businesses have reached the point where it is as cheap or cheaper to invest in new software and hardware to increase productivity and be able to do more with less employees?
-
-
The reality is that it is most likely a combination of all the above theories. What is important to remember is that one year does not establish a trend so it would be a mistake to jump to conclusions. At the same time, with the economy still growing it is a good time to be considering the above theories and develop a game plan to succeed if any or all the above theories prove true over time.
Disclosures
-
All data for this week's newsletter comes from the Bureau of Labor Statistics.

Steve is the Economist for Washington Trust Bank and holds a Chartered Financial Analyst® designation with over 40 years of economic and financial markets experience.
Throughout the Pacific Northwest, Steve is a well-known speaker on the economic conditions and the world financial markets. He also actively participates on committees within the bank to help design strategies and policies related to bank-owned investments.