



Economic Summary
One topic that has been making headlines recently is the fact that real personal spending is growing at a far faster rate than real disposable personal income and how can this continue? This month's newsletter attempts to answer that question.
Soundbite
At first glance, it would appear that consumers are spending beyond the income they receive. Since the start of 2021, year-over-year real disposable personal income growth (1.7%) has lagged real personal spending growth (3.9%) by over two full percentage points. That has led many to argue that the consumer is running out of “dry powder” to keep spending. Digging into the details reveals that most consumers still have plenty of spending power. The problem lies in how the Bureau of Economic Analysis classifies spending. Distributions from a retirement fund (i.e., pension, IRA, 401(k), etc.) and liquidations of financial assets do not count as income but clearly provide cash available for the consumer to spend. Some economists have taken to calling this economy the “K-shaped G” economy because the amount of spending power available from non-income sources is clearly bifurcated by generations.
Analysis
This month's newsletter examines how the real (adjusted for inflation) personal spending rate can continue to run so far in front of the real disposable (adjusted for inflation and taxes) personal income growth rate. Since we know different age groups have different income levels and spending patterns, the analysis will examine the data by four age groups:
-
Under 40 years old
-
Between 40 and 54 years old
-
Between 55 and 64 years old
-
65 years or older
This analysis will use a combination of data from the Bureau of Economic Analysis (BEA), Federal Reserve, and the Internal Revenue Service (IRS). An important point to remember is that much of this analysis is analyzing potential funding sources available to support spending. The data does not identify how much, if any, of each potential funding source was used to support spending, but at the end of the newsletter I will provide an estimate of the “spending power” of the non-income sources of liquidity.
Caveat:
The BEA and Federal Reserve data is actual data through 2024. IRS data is only published through 2023. This is because it takes the IRS far longer to release data given how long people have to pay their taxes (2025 taxes are still being paid). Once all taxes have been paid it has to compile all the data, anonymize it and then publish the data. Because of this, you will see different colors for 2024 and 2025 compared to 2021 through 2023. The 2021 through 2023 data is the actual historical data, while the data for 2024 and 2025 is estimated using data-backed trendline projections. Since the BEA and Federal Reserve data is current, we can identify the trends and the correlation of the IRS data to the BEA and Federal Reserve data to estimate the 2024 and 2025 IRA data. I will identify graphs that have IRS data and you will see different colored bar charts for 2024 and 2025. Ultimately, the actual data may be different, but the direction and trend should be accurate. If you do not like estimates, then you will want to only focus on the data through 2023.
Let us start by conducting a net cash flow analysis (net cash flow = income minus spending). This will identify if consumers are receiving enough income to pay for their spending or if they have a surplus or deficit. What the first graph highlights is that the 40 to 54-year age group runs the highest consistent surplus where their income is more than their spending. The 55 to 64-year age group runs the second biggest surplus. The youngest age group (under 40 years old) and the oldest (65 and older) consistently spend more than the income they receive. 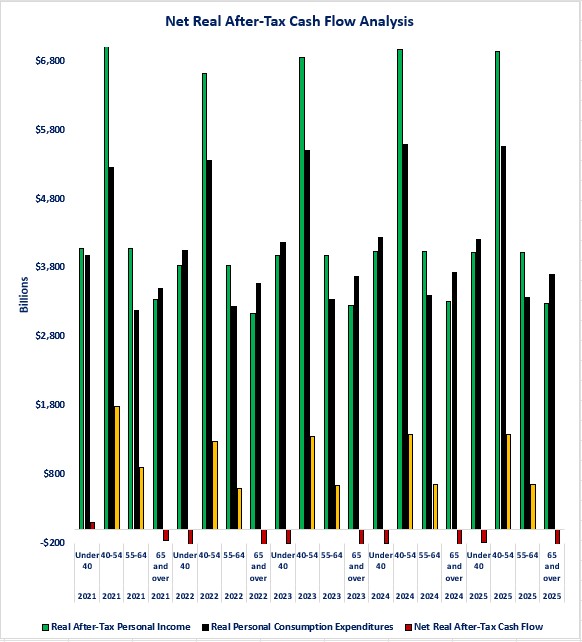
By strictly examining the above graph. one of the incorrect conclusions that one could reach is that retirees (65 and over) and younger people are under financial stress as their total real spending is more than their real disposable income. The problem with that conclusion is the fact that the Bureau of Economic Analysis' (BEA) mandate is to track income, not what I call “spendable liquidity.” The problem is that the BEA definition of income does not consider two potential funding sources for spending:
-
Retirement fund distributions (i.e., pension, IRA, 401(k), etc.) as income. Social Security counts but retirement distributions do not.
-
Spendable financial assets
Let us start by examining retirement fund distributions. The Internal Revenue Service (IRS) tracks retirement fund distributions. The graph below shows the real disposable retirement distributions. The biggest retirement fund distributions are those from pensions, annuities, IRAs, 401(k)s, 403(b)s and 457 plans.
It should come as no surprise that retirement distributions are a potential funding source for spending for the older population since that is the age group most likely in retirement. The 65 and older population is the most likely to be retired, but the 55 to 64 age group may be people taking early retirement. When you consider the graph above, the negative difference between income and spending for the 65 and older population is less than $200 billion. The potential funds from pension payments alone fully cover that gap.
You might look at the graph and wonder “how does someone under 40 years old get retirement fund distributions?” The answer is that there are several situations where someone under 40 may receive a retirement fund distribution.
-
Inheritance. If you inherit a 401(k) or IRA, tax rules require you to drain the entire inherited balance within 10 years of the original owner's death.
-
Early withdrawals and hardships.
-
Qualifying IRS penalty-free withdrawal. There are three scenarios where you can make a penalty free withdrawal.
-
Up to $10,000 if the proceeds are used to buy your first home.
-
Qualifying college or graduate school expenses.
-
Up to $5,000 to cover birth or adoption expenses.
-
-
Rule 72(t) withdrawals. Without going into all the details, a younger person who has accumulated a large amount of wealth (think of technology workers) is allowed to draw down the wealth, penalty free, if they conform with all the rules associated with Rule 72(t).
-
Military pensions and disabilities. Someone who went into the military at age 18 and served for at least 20 years can start receiving military pension at age 38. If they become permanently disabled, the IRS allows penalty-free early withdrawal from retirement accounts and starts making disability payments immediately.
Recognize that while most of these options allow penalty-free withdrawals, the recipients will still pay ordinary income tax on the proceeds.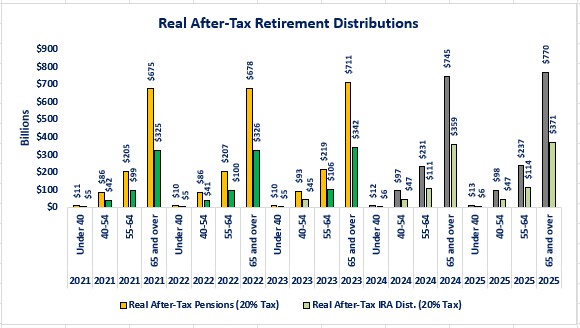
The second form of liquidity that can be used as a potential funding source to support spending are what I will call “spendable” financial assets. For this newsletter, the following financial assets will be defined as spendable assets because they can be liquidated quickly at or close to market value.
-
Deposits
-
Money Market Funds
-
Stocks and Bonds
-
Mutual Funds
Private funds (equity and credit), real estate, cash value of life insurance policies and other illiquid assets are not considered spendable assets due to the time it may take to liquidate the asset and the potential discount for selling early or having a lack of demand for the asset. As a result, for the rest of this newsletter spendable assets mean the four asset types identified above.
The Federal Reserve tracks financial assets of the US population. Using that data, the first graph below shows the total market value of the spendable assets over the past five years. As you can see, after a dip when interest rates were rising (2022), these four spendable assets have steadily appreciated in value each year. After the dip in 2022 total spendable assets grew 15.0% year-over-year in 2023, 8.8% in 2024 and 14.1% in 2025. Including the dip, the total growth over the past five years was 27.3%. This is one of the factors leading economists to characterize the current economy as a K shaped economy. If you own financial assets, you are on the rising arm of the K. If you do not, you are most likely on the declining leg of the K.
From a spending standpoint, someone who holds these types of spendable assets could liquidate all or part of these liquid assets to buy a big-ticket item like a car, or vacation. 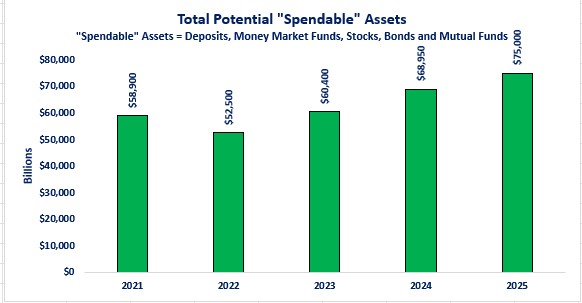
Now let us examine the spendable asset picture by age. The second graph breaks out the yearly spendable asset totals by four age groups:
-
Under 40 years old
-
Between 40 and 54 years old
-
Between 55 and 64 years old
-
65 years or older
It probably comes as no surprise that older people hold more spendable assets than younger people. The graph below provides the proof. As you can see from the graph, overall, the older someone is, the more spendable assets they own. The people who are 65 and older hold the biggest amount of the spendable assets while the people under the age of 40 hold the smallest amount. This should not be surprising since the older generation has had more time to accumulate financial assets and most likely experienced the greatest appreciation in market value, while the youngest category is still in the accumulation phase.
Once again, the size of the spendable assets that could be used as a funding source for spending calls into question whether the older population is really under financial stress the way the first graph implied. Yes, from a pure BEA income definition, their income is declining because they are retiring. Having the “dry powder” in the form of their spendable assets changes the story. What we know from the data is that, as of 12/31/25, the US population of people 65 years or older holds $32.1 trillion in spendable assets. The fact that the youngest age group holds $3.6 trillion also indicates that these assets may be playing a role as a funding source for spending.
Anecdotally, there have been more stories of older parents using their spendable assets to help their children by funding the purchase of their first house or providing the down payment due to the affordability issues for first time home buyers. Liquidating some of their spendable assets could have played an important role in that process. Another scenario where liquidation of spendable assets may be playing an important role is people who are now moving into senior living communities. Many of these communities have a substantial buy-in requirement that ensures no increase in rent (above the normal rent increase) if they need to transition to an assisted living arrangement or memory care. For many, the growth of their spendable assets makes it possible for them to transition to that type of senior living community.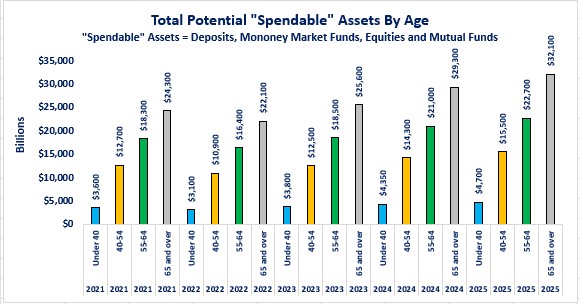
Estimated spending power of the non-income source of liquidity.
The IRS data identifies the amount subject to taxes from these non-income sources, but it does not identify if the liquidity event (i.e., payments or sale of assets) was used for spending. The following is my attempt to illustrate the spending power that can be used for spending. I intentionally took a conservative approach to calculate how much “spending power” the non-income liquidity sources generate, but this analysis is a “best estimate” calculation. Here are the assumptions that I used.
-
Analysis is adjusted for inflation and after-tax to remain consistent with the rest of the analysis.
-
It is assumed that younger people have an ordinary income tax rate lower than older people.
-
12% for those under 40 years old.
-
22% for those between the ages of 40 and 54.
-
32% for those between the ages of 55 and 64.
-
37% for those over the age of 64.
-
-
A 20% capital gains rate is used for all age groups.
-
100% of Pensions and Annuities distributions are available as a funding source for spending.
-
10% of distributions from IRA, 401(k), 403(b) and 457 is available as a funding source for spending.
-
Studies by Vanguard and the Center for Retirement research found that people with modest savings reinvested 33% of the distribution from a retirement account while wealthier individuals reinvested virtually 100% of the distribution. Essentially, they were only taking distributions because the law requires it, but they reinvested the sales into an investment account.
-
-
10% of the proceeds from the sale of the financial assets are available for funding spending. The remaining proceeds were reinvested.
-
The amount of financial assets that were sold is 5 times the amount of the capital gains associated with the sale.
-
The IRS data shows that, historically, gross proceeds from the sale of an asset are 4-6 times the size of the realized capital gains, depending on the year and the financial markets' performance.
-
This analysis assumes that most of the sales activity of financial assets is due to re-balancing or replacing one asset with a new asset and is not available as a funding source for spending.
-
-
Based on those assumptions, here is a table that generates an estimate of total real after-tax non-income spending power (i.e., liquidity available so support spending). Numbers are in billions.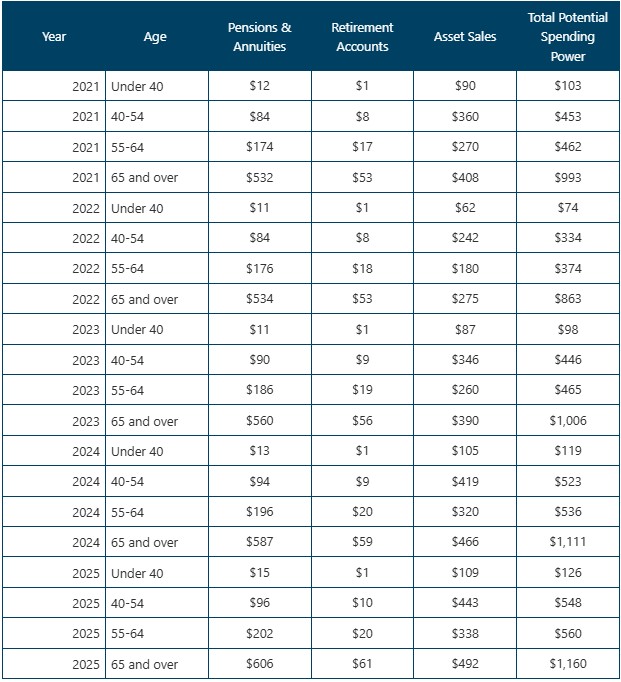
We can see from the above table that non-income liquidity sources provide consumers with more spending power than what the official Real Disposable Personal Income data would suggest. This is a macro view, and clearly, not everyone in each age group is in the same financial position. Even from the macro view, it is important to understand the concentration of the spendable financial assets. Based on the most recent Federal Reserve data, people under the age of 40 only own 9.7% of deposits and money market funds and 5.1% of stocks, bonds, and mutual funds. People who are 65 or older own 42.2% of deposits and money market funds and 43.0% of stocks, bonds, and mutual funds. This truly paints a picture of a “K-shaped G” economy. That means one way to understand the current economy is through the lens of the different generations. Based on the official real disposable personal income versus real personal spending data, the oldest and youngest age groups appear to have a deficit cash flow. When the non-income liquidity sources are added in, the oldest age group has far more potential spending power from the non-income sources compared to people under the age of 40.
Closing Thoughts
-
Just looking at the headline data would give the impression that the consumer is spending at a faster pace than their income is growing and that this cannot continue.
-
Breaking it down by age group shows the oldest and youngest age groups appear to be spending more than the income they are receiving.
-
-
A deeper look reveals that two sources of liquidity that can be used to support spending are not classified as income by the Bureau of Economic Analysis. When considering those two sources, the implication is that spending at its current pace could continue for longer than many expect.
-
The headline story will most likely get worse as time progresses and more people retire. That does not mean that the financial health of all retirees will get worse. It simply means that there is a blind spot in the BEA's personal income data.
-
In no way does this analysis conclude or imply that people do not need Social Security or other social assistance programs to survive.
-
This analysis is a macro view.
-
Let us not kid ourselves that everyone shares this financial picture. Social Security is the sole source of funding to support spending for many people while others need other social assistance programs to survive. This is part of the K-shaped description of today's economy.
-
Within each age group there are people who receive retirement fund distributions, and own spendable assets, but there are also people who have no retirement funds or spendable assets and rely heavily on social assistance programs to survive. This describes the “K-shaped G economy.”
-
Disclosures
-
The data on financial assets derives from the Federal Reserve's Distributional Financial Accounts data.
-
The data on disposable personal income comes from the Bureau of Economics' Personal Income data.
-
The capital gains and financial assets sales data comes from the Internal Revenue Service's Statistics of Income data.

Steve is the Economist for Washington Trust Bank and holds a Chartered Financial Analyst® designation with over 40 years of economic and financial markets experience.
Throughout the Pacific Northwest, Steve is a well-known speaker on the economic conditions and the world financial markets. He also actively participates on committees within the bank to help design strategies and policies related to bank-owned investments.