


Economic Summary
It was another busy week of economic data releases and another case of mixed results.
Construction
The Census Bureau reported a 0.4% increase in construction spending in April. This was an improvement from the 0.2% increase in March.
Housing
Mortgage applications continued to decline as they fell 2.5% last week. Applications to purchase a house fell 2.9% while applications to refinance fell 2.3%. The average 30-year mortgage rate dropped from 6.65% to 6.57%.
Jobs
The Challenger layoff report showed a 3.4% increase in announced layoffs in May compared to last May. The Bureau of Labor Statistics (BLS) reported a 753,000 increase in job openings in April. The number of hires rose 419,000, layoffs fell 192,000 and the number of people quitting their job fell 183,000. The Department of Labor reported a 13,000 increase in filings for initial unemployment benefits last week Even with the increase, the level was 225,000, which remains within the 200,000 to 250,000 range. Continued claims fell 8,000 to 1,777,000. ADP reported a 122,000 increase in new jobs in May. This was an increase from the 105,000 level in April.
The highly anticipated jobs report from the BLS was released on Friday. The report showed a 172,000 increase in May. Average weekly earnings rose 3.7% on a year-over-year basis and the unemployment rate remained unchanged at 4.3%.
Manufacturing
S&P reported an increase in its Manufacturing PMI data. The index rose from 54.5 in April to 55.1 in May. ISM also reported an increase in its PMI data as the index rose from 52.7 in April to 54.0 in May. Factory orders rose 4.8% for the month of April compared to a 1.8% increase in March. Excluding the volatile transportation (i.e., aircraft) component, orders rose 1.3% compared to 1.8% in March.
Productivity
Non-farm productivity slowed in the first quarter. Non-farm productivity rose 0.3% versus a 1.8% increase in the 4th quarter of 2025.
Service Sector
S&P's service sector PMI slowed from a 50.9 level in April to 50.7 in May. ISM's non-manufacturing PMI rose from 53.6 in April to 54.5 in May.
Wages
Unit labor costs slowed to a 1.8% increase in the 1st quarter after rising 4.4% in the 4th quarter of 2025.
Perspectives
Soundbite
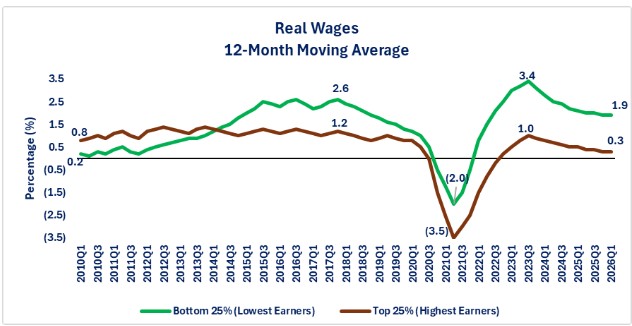
While inflation has dominated the headlines, especially as it relates to the financial stress it is creating for the lower wage earners, the untold positive story is that the lower wage earner is quietly winning over the higher wage earners when it comes to real wage growth. Since the 1st quarter of 2010, real wage growth for the bottom 25% of wage earners has grown at least twice as fast as the top 25% when measured on a 12-month moving average. Currently the bottom 25% are experiencing real wage growth, which is 2.3 times faster than the top 25%. The good news is that the wage gap is incrementally closing. Even though the gap between actual monthly wages remains wide, the faster real wage growth of the bottom 25% could provide faster economic stimulus as they will most likely spend the increase in earnings while the top 25% will most likely put the increase to savings or investments.
Analysis
The Atlanta Federal Reserve maintains data on wage growth via its Wage Growth Tracker Index. This index calculates the nominal wage growth (growth before subtracting inflation) of individuals, matching the same 12-month interval from the Bureau of Labor Statistics (BLS) Current Population Survey, and breaks the data down by wage percentiles. Real wage growth is then calculated by subtracting the growth in the Consumer Price Index. Tracking real wage growth helps us understand the impact to the average consumer's purchasing power.
Let us start by examining the growth rate of real wages since the 1st quarter of 2010. This will help give perspective on what the trend looked like during the last economic expansion (2010-2019), the pandemic distortion, and the economic expansion since the end of the pandemic distortion. What we discover are four trends.
-
The sluggish start to the expansion after the financial crisis (2010-2014).
-
Essentially, since businesses had a large pool of applicants for jobs coming out of the Great Financial Crisis recession, wage growth was slow with growth ranging between 0.2% and 1.5% real growth. You can see from the graph below that the real wage growth for the upper 25% of wage earners consistently outpaced the bottom 25% during this period as specialized roles were in higher demand than jobs in the service sector.
-
-
The tightening of the labor pool from 2014-2019.
-
By 2019 there were more job openings than unemployed people. As a result, businesses had to compete for labor. Workers at the lower end of the pay scale benefited from this more than the upper end. The graph shows is that since 2014 real wage growth has consistently been faster for the bottom 25% of wage earners than the upper 25%.
-
-
The pandemic crisis distortion.
-
After the pandemic crisis ended, labor shortages were an issue as fiscal stimulus (i.e., extended unemployment benefits, stimulus checks and moratoriums of rent, mortgage payment, and student loan payments) created a dis-incentive for people to return to work, especially the lower wage earners. This was a double “whammy” for businesses because demand for services surged when the economy re-opened after the COVID shutdown. Many economists framed this surge as “revenge spending” as people had money from the fiscal stimulus and spent much of it on services (restaurants, hotels, travel, visits to medical providers, etc.). These types of services (Leisure & Hospitality and Healthcare & Social Assistance) are where many of the lower paying jobs reside. The constrained supply of labor and the increase in demand for services resulted in faster wage growth for the bottom 25% of wage earners.
-
-
The post-distortion cooling.
-
As the fiscal stimulus played out, revenge spending finished and higher interest rates and fiscal policy created elevated uncertainty, demand for labor slowed and real wage growth slowed.
-
The second graph shows the historical trends for the growth gap (i.e., the percentage point growth differential between the bottom and top 25%). The graph below illustrates the surge/distortion that was created from the fiscal stimulus during the post-pandemic distortion between 2021 and 2023. At its peak, the gap between the real wage growth of the bottom 25% of wage earners compared to the upper 25% was 2.4 percentage points. As inflation cooled, interest rates rose, and fiscal policy created uncertainty, job hiring slowed to the point where the nation barely added jobs in 2025. The area of jobs growth was primarily in the Healthcare & Social Assistance sector. Again, this is where many of the lower paying jobs reside. The continued demand for hiring in the lower paying jobs resulted in higher real wage growth. The declining demand for higher paying jobs-especially with job losses in the technology industry-resulted in real wage growth slowing more for the upper 25% of wage earners compared to the bottom 25%. The gap steadily declined from the second half of 2023 through the most recent date (1st quarter 2026). The important thing to observe is that the gap has remained positive for the bottom 25% of wage earners.
Some might argue that this is not really good news because the bottom 25% are still making a lot less money than the upper 25%. While true, the gap is narrowing. If we use the example of the highest paying industry sector (Utilities) versus the lowest paying (Leisure & Hospitality), the incremental improvement exists. As of 4/30/26, the Utilities sector pays $2,393 per month, Leisure & Hospitality sector pays $601. A 0.3% increase on $2,393 is a $7.18 increase in monthly pay. A 1.9% increase on $601 is an $11.42 increase in monthly pay. For the bottom 25% that most likely provides immediate additional income that is spent on essentials. Every additional dollar matters for the bottom 25% of wage earners and thus the incremental increase in real wages is positive for them.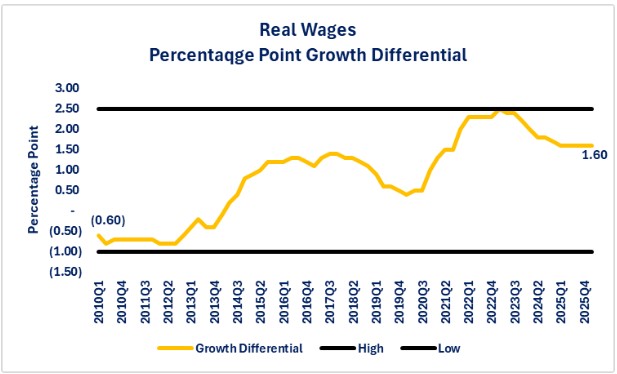
Closing Thoughts
-
When the media covers wage growth, the focus almost always seems to focus on the impact of inflation. It is easy to fall into the trap of assuming that rising prices have wiped out everyone's pay increases.
-
The data shows a more positive underlying story: purchasing power has grown incrementally since the end of the 4th quarter of 2022.
-
-
If you strictly looked at the dollar increase in wage growth between the upper 25% of wage earners compared to the bottom 25%, you might not think that there is any good news in the real wage data from the bottom wage earners perspective when, in fact, there is.
-
Where there is good news is the fact that faster growth in real wages for the bottom 25% of wage earners compared to the upper 25% results in incremental improvement in the financial health of the lower wage earner.
-
History has shown that the bottom 25% of wage earners have a higher propensity to spend the increase versus the upper 25%, who tend to save the increase.
-
That is not because the lower 25% of wage earners are spendthrifts or irresponsible in their spending. The economic reality is that every dollar increase in wages helps the lower 25% pay their bills, buy their basic essentials, and possibly reduce debt.
-
This is good news for the lower wage earner as, all else being equal, every dollar increase in wages is an incremental improvement in the financial health or an incremental decrease in the financial stress of the low-income wage earner.
-
-
The good news of the stronger real wage growth for the bottom 25% does not mean that their financial stress has been resolved. That struggle is real and continues.
-
We know that real average weekly earnings fell 0.2% year-over-year as of April. That means that earnings power decreased for the average worker.
-
-
From an economic viewpoint, it is important to look past the size of the dollar increase and understand how the dollar increase may impact the economy.
-
The dollar increase that is used for spending has a multiplier effect throughout a local economy as businesses benefit from increased sales. Ultimately that could be the difference for a small business being able to survive or close their doors. Improved health of businesses can then create a multiplier effect if demand continues to increase as wages increase and new jobs are created to meet the increased demand.
-
-
Ultimately, if growth in real wages continues to be stronger for the lower 25% of wage earners versus the upper 25%, it should create a structural improvement in the economy by building a stronger foundation that is supported from the bottom up rather than relying heavily on the upper wage earners.

Steve is the Economist for Washington Trust Bank and holds a Chartered Financial Analyst® designation with over 40 years of economic and financial markets experience.
Throughout the Pacific Northwest, Steve is a well-known speaker on the economic conditions and the world financial markets. He also actively participates on committees within the bank to help design strategies and policies related to bank-owned investments.