


Economic Summary
It was a slightly lighter calendar this week's economic data with all eyes focused on the two inflation reports. It will probably come as no surprise for most readers that the inflation data continued to show prices increases driven by the energy sector.
Consumer Sentiment
The University of Michigan Consumer Sentiment index rebounded in June as the index rose to 48.9 compared to a 44.8 reading in May. The Current Conditions sub-index rose to 48.4 versus a 45.8 level in May. The Future Expectations sub-index 49.3 compared to 44.1 in May.
Housing
Existing home sales rose 3.2% in April after rising 0.7% in March. Mortgage origination activity rose last week as evidenced by the 10.8% increase in mortgage applications. Applications to purchase a house rose 7.3% while applications to refinance rose 15.3%. The activity was not due to a drop in mortgage rate as the average 30-year mortgage rate rise slightly from 6.57% to 6.60%.
Inflation
The Consumer Price index rose 4.2% on a year-over-year basis in May. Once again, the headline index was driven by a 23.5% increase in energy costs. The Core Consumer Price index (excludes food and energy prices) rose 2.9%. The situation was worse for businesses as the Producer Price Index rose 6.5% compared to 6.0% increase in April. Energy prices rose 36.6%, prices on goods rose 10.4% and prices on services rose 4.9%. The Core Producer Price index rose 4.9% after rising 5.2% in April.
Jobs
Initial Jobless claims 4,000 to 229,000. Although initial claims have been slowly rising over the past month, they continue to be range-bound between 200,000 to 250,000. Continuing claims rose 24,000 to 1,795,000. Continued claims show a clear rising pattern as it is taking people longer to find a job if they are laid off.
Wages
For the second month in a row inflation grew faster than wages. As a result, real average hourly earnings fell 0.2% in May after falling 0.2% in April.
Perspectives
Soundbite
State level Real GDP (GDP) results are another example of the bifurcation that exists within the US economy. The good news is that 49 out of the 50 states experience positive year-over-year growth. The data also highlights the role that spending on technology has had for both state and national GDP. The state data also highlights why the national data does not accurately reflect what is happening for each individual state. The takeaway from the data is that you are not crazy if you are not experiencing what the national GDP data is showing for US economic growth. At the micro level, I continue to counsel to believe what you are experiencing if it is different than the national data that is reported in the media. Plan your business or personal financial strategies based on what is happening in your local economy.
Analysis
Real GDP (GDP) is the way the US measures its economic growth. The headlines focus on the national GDP data. What does not make the headlines is the state-level GDP data even though each reader probably cares more about how their state economy is doing versus the national economy. This edition of Economic Perspectives examines the year-over-year growth of those states whose GDP outperformed that national number as well as the 10 states that underperformed that national number the most.
Let us start by examining the cumulative growth states that experienced faster year-over-year GDP growth than the US. As you can see from the graph below, there is no clear evidence that location or political leanings drive outperformance. The Bureau of Economic Analysis divides the US into eight regions. Out of the 18 states that outperformed the US year-over-year GDP growth, all regions have at least one state that outperformed the US. The Plains region had the most states with four. Two regions had three states, three regions had two states, and two regions had one state. The well-established and resected Cook Political Reports Partisan Voting index identifies states by three political categories: Republican leaning, Democrat leaning, or Split. Out of the 18 states, nine are classified as Republican leaning, six are classified as Democrat leaning, and three are classified as Split states.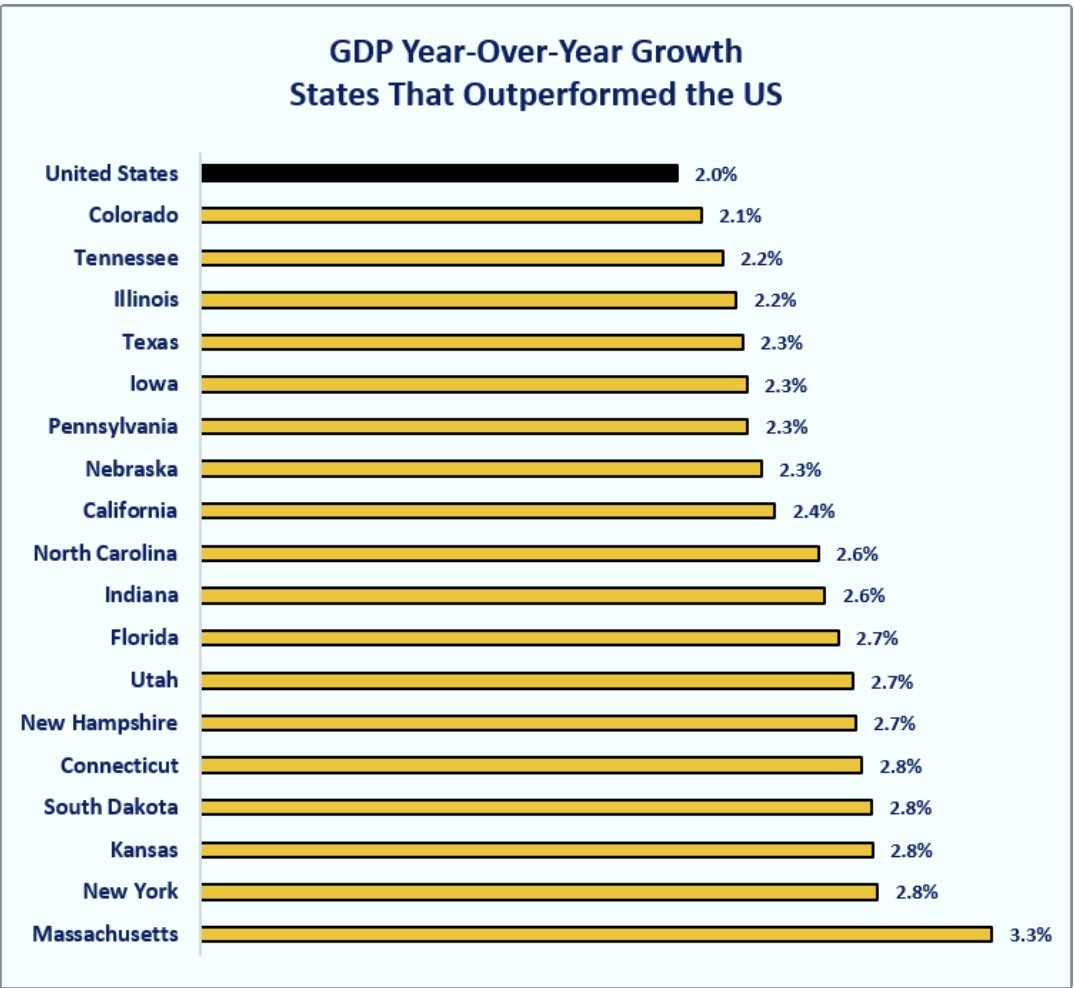
Let us examine the contributions of each industry sector towards the state GDP to see if there are patterns revealed. Examining this data reveals more of a pattern, but not a clear and distinct pattern. As you can see from the table below, the Information industry dominated as the top contributor to total state GDP. Out of the 18 states, 11 had the Information industry sector contributing the most to the state's total GDP. What is just as interesting is the percentage of total year-over-year GDP growth for the top contributing sector. The lowest percentage is 22.3% for the Information sector in Texas, while the highest percentage is The Agriculture, Forestry, Fishing, and Hunting sector in Nebraska at 71.4%. High concentrations raise the risk that if something happens to that industry sector, the state could face high financial stress.
The telling metric to consider is how much of the year-over-year US GDP growth did the 18 states comprise? What the data reveals is how concentrated the US GDP growth is. The 18 states that outperformed the US accounted for 81.4% of the total year-over-year US GDP growth. That may help explain the divergent views that people have about the health of the economy.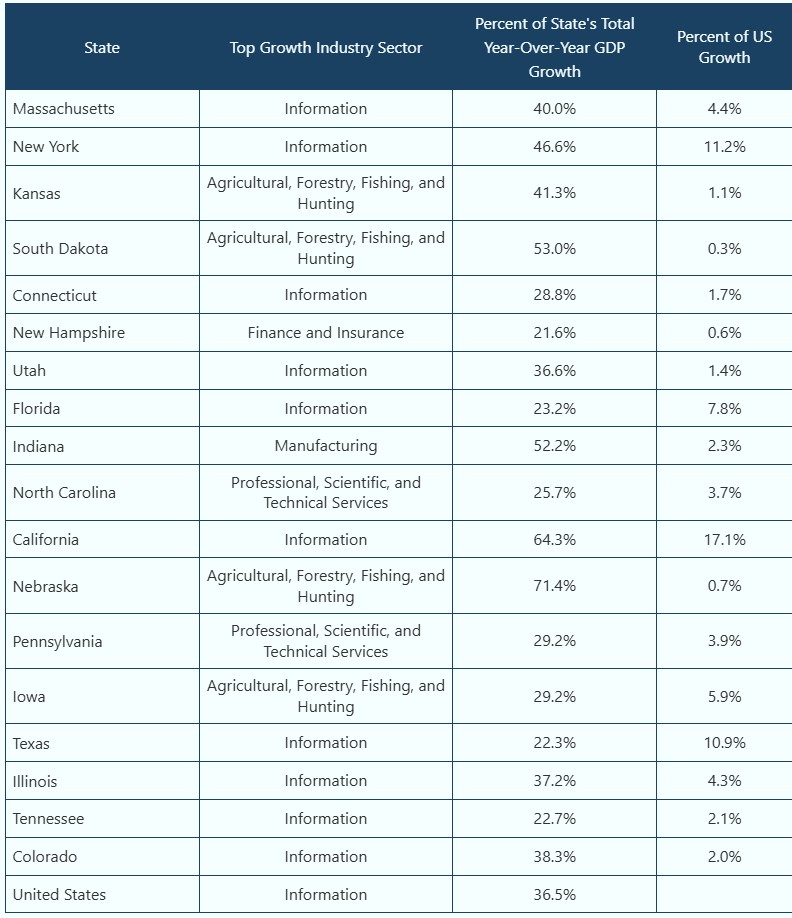
Now let us examine the 10 states that underperformed the US the most. As the below graph highlights, the 10 states with the weakest year-over-year GDP growth grew 1% or less. One state-Maryland-had negative growth. Of the three states where Washington Trust Bank has offices, two fell into the bottom 10. Some might be surprised to see Idaho in the bottom 10. What you must remember is that Idaho has consistently had stronger year-over-year growth than the US. Since 2014 Idaho has only underperformed for one quarter in 2021 and three quarters in 2023. Since the current underperformance has only existed for two quarters it is too early to tell if this is another temporary underperformance.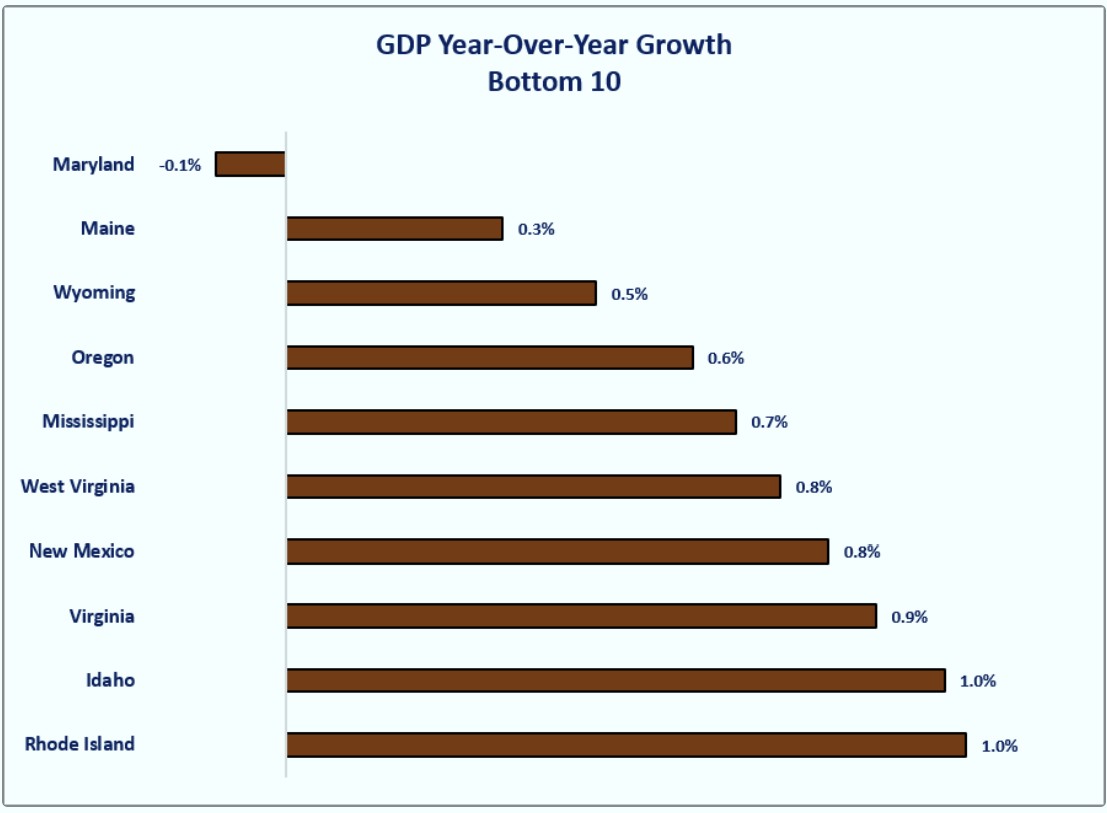
Examining the data in the table below reveals that there is no clear dominant industry in the way the Information industry dominated the top 18 states. The concentration in the top performing industry is more pronounced. As you can see from the table, on a net basis, one industry made up over 100% of the year-over-year performance. That is because there were other industries that had severe negative growth. The best example of this is Maryland, where Information makes up 458.4% of Maryland's total year-over-year GDP growth. This is because Maryland's total growth was negative with many industries showing negative growth. That means that since the Information sector had growth, the percentage becomes a big number.
The important thing to note for the bottom ten is that they make up 2.64% of total year-over-year US GDP growth.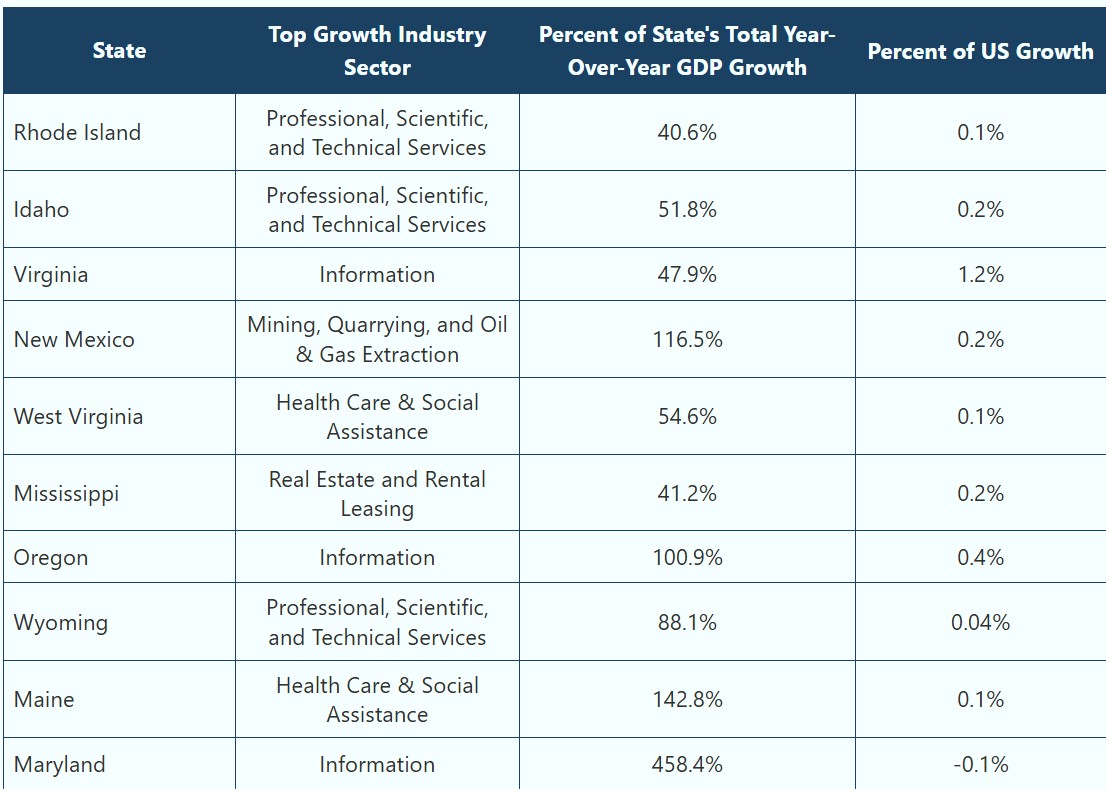
Closing Thoughts
-
The state GDP data is another example of a bifurcated economy with 18 states making up over 80% of total year-over-year GDP growth.
-
Many states have concentrations in the industries that are driving growth. From a risk management perspective, that exposes the state to the ebbs and flows of the dominant industry.
-
The data shows the impact of spending by the technology companies (part of the Information sector) on both state and national GDP.
-
The spending from the Information sector accounted for 36.5% of the total year-over-year growth for the US.
-
The average for the 50 states was 26.4% with a high of 100.9% for Oregon (excluding the outlier for Maryland) and low of 7.2% for Indiana.
-
-
Do not be surprised if what you are experiencing in your economy does not match the official GDP numbers reported for the US.
-
There is nothing nefarious about that. It is because the US is a combination of 50 different economies that are each different and unique.
-
-
The good news is that 49 out of the 50 states have experienced growth from the 4th quarter of 2024 to the 4th quarter of 2025.
Disclosures

Steve is the Economist for Washington Trust Bank and holds a Chartered Financial Analyst® designation with over 40 years of economic and financial markets experience.
Throughout the Pacific Northwest, Steve is a well-known speaker on the economic conditions and the world financial markets. He also actively participates on committees within the bank to help design strategies and policies related to bank-owned investments.