


Economic Summary
Affordability has clearly been the narrative during this election season and housing affordability has been at the forefront. One of the drivers for affordability is whether there is enough supply of housing to meet the growth in household formation. Today's Perspectives section examines new household formation versus total available housing supply.
Perspectives
Soundbite
The dominant reason being given by many economists, analysts, and the media to explain the housing affordability problem is that there is a lack of supply of housing. The data tells a slightly different story. Single family housing has not produced enough supply for new household formations since 2009, but not all new households want single family housing immediately. Small multi-family (2-4) units have barely moved the needle over the past 25 years while large multi-family units (5 or more) saved us from a worse shortage. Unfortunately, the boom now appears to be fading for this category. Manufactured housing is the underutilized source while the most volatile contributor to housing units is the change in vacancies of existing units. What the data shows is that, over the last 25 years, the US has gone through periods of surpluses and shortages in housing supply rather than a continuous shortage. In order to address the housing situation, all stakeholders need to understand when the shortages occurred, how deep they were, what types of supply filled or created the gaps, and what may be the supply of the future.
Analysis
To start the analysis, it is important to provide definitions so that we are all on the same page for what the analysis shows.
Household Formations
By Census Bureau definition a household is:
-
All people who occupy a housing unit.
-
Households are not people living in group quarters (e.g., dorms, nursing homes, prisons, shelters, or military barracks).
Housing Unit
- When many people hear “housing” they often think of single-family homes. In fact, “housing” has a broader definition that incorporates the following:
- Single-family homes, apartments, group of rooms, or single room used as a separate living quarter.
- A housing unit qualifies as a “separate living quarter” when the occupants live separately from others in the structure and have direct access from outside or through a common hall. Living in your parents' basement or moving back into your parents' house does not normally qualify as a housing unit.
Let us start by examining household formations. As the graph below shows, household formations experienced a steep drop heading into and during the Great Financial Crisis (GFC) recession. This could be a result of people moving back in with their parents or households consolidating where more than one family lived in a housing unit due to the negative financial impact of the GFC recession. It could also be that, because of the GFC recession, younger people stayed in school longer and utilized the dormitories as a place to live. The recent drop since 2021 could reflect the surge in the price of single-family homes and rents for all types of units. This could once again result in people staying in or moving back into their parents' homes and families consolidating where more than one family lives in a housing unit. From the low of 99,000 household formations in 2008, the trend has been volatile but rising through 2022. After the drop between 2021 and 2024 household formations rose again in 2025. Whether this is a new rising trend remains to be seen.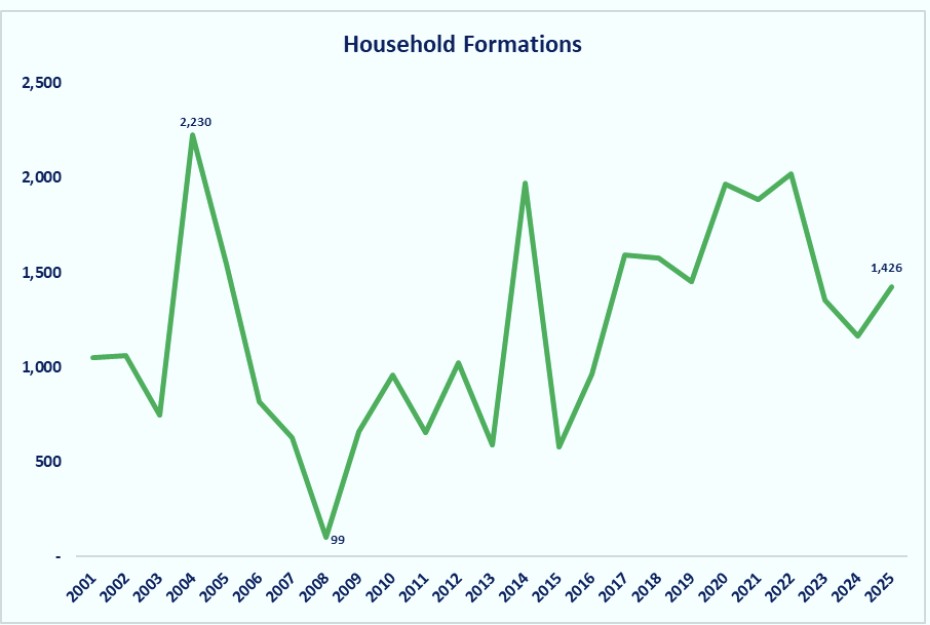
Now, let us examine the sources of housing units that help meet the demand from household formations. The graph below shows the five sources of housing units. Let us start with the biggest contributor first.
Single-Family
During the mid to late 2000's the Single-Family category tracked reasonably well with household formations, but not as volatile. On its own, the Single-Family category met or exceeded the demand from household formation including generating surpluses each year between 2001 through 2008, except 2004, . That changed in 2009 and the Single-Family category experienced a dramatic drop during the GFC recession and has yet to approach the levels that existed from 2001 through 2008. As a result, the gap between household formations and single-family completions was negative for all years since then, except 2015. At its worst, the deficit was 1,355,000 units in 2014. That has improved recently but the deficit is still 416,000 as of the end of 2025. It is important to remember that not all new households want a single-family housing unit, so it is not necessary for the Single-Family completions to match Household Formation. Younger couples may not desire a single-family housing unit until they have children.
Existing Housing Vacant Inventory
The Existing Housing Vacant Inventory category is a source of housing supply that is often overlooked by many economists, analysts, and media. The Existing Housing Vacant Inventory category represents housing units that are sitting empty. One caveat is that a vacant unit is not necessarily a unit ready to be occupied and the Census Bureau does not provide data to identify how much of the vacant inventory is ready to be occupied. With that caveat understood, the data shows that between 2001 through 2009, vacant units increased except for 2004. The Existing Housing Vacant Inventory category functioned as a shadow reservoir of available housing units during that period. After the GFC recession, when single-family completions plummeted, the shadow inventory of vacant units began to disappear. Between 2010 through 2022 the Existing Housing Vacant Inventory has been negative 10 out of the 13 years. That means the market absorbed more of the existing vacant inventory than new vacant inventory that was created.
Large Multi-Family (5+ units)
What the graph below shows is that the Large Multi-Family category languished in the 130,000 to 310,000 range though most of the 2000s and early 2010s. Then a combination of factors led to a surge in Large Multi-Family production. These factors included:
-
Regulations and zoning codes that encouraged Large Multi-Family production,
-
Institutional capital being invested in projects,
-
Demand from Millennials, and
-
Basic necessity for people to find an affordable form of housing units.
By 2024, the Large Multi-Family category hit a peak completion level of 592,000 units. It slowed to 472,000 units in 2025. Is this the start of a slowdown in Large Multi-Family production or simply a pause?
Manufactured Homes
The Manufactured Homes category is the third biggest contributor to housing supply. Supply for this category peaked at 193,000 units in 2001 and then collapsed during the GFC recession to 50,000. Since the end of the GFC recession this category has gradually increased back to being slightly above the 100,000 level. Given the fact that manufactured homes can be delivered at lower prices than single-family homes, you would think this category should get more attention as part of the solution for creating affordable housing. Even though manufactured homes could be one of the fastest, lowest‑cost ways to expand affordable housing, policy, financing, insurance, and perception challenges continue to limit their widespread use.
Small Multi-Family (2-4 units)
This category produces the smallest amount of housing unit supply. Looking at the graph below, you can see that the Small Multi-Family category barely moves the needle for supplying housing units. You might think the grey line is the horizontal axis of the graph when it is actually the Small Multi-Family category.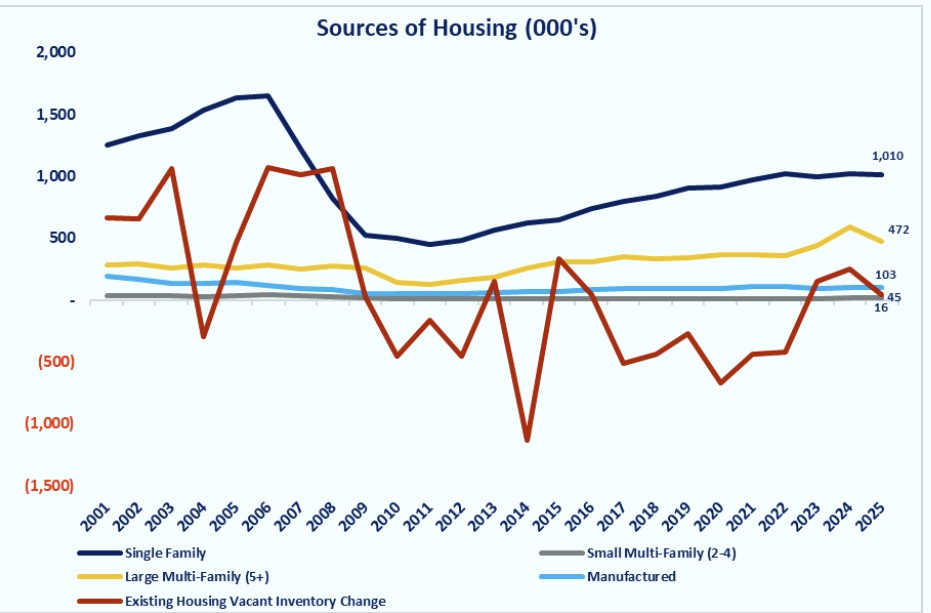
The next graph shows the growth of household formations versus total available housing supply. What we can see from the graph below is how the surplus or shortage of housing units is episodic. It went through phases as household formation are difficult to predict with ties to economic conditions and housing unit production occurring with lags in response to household formations.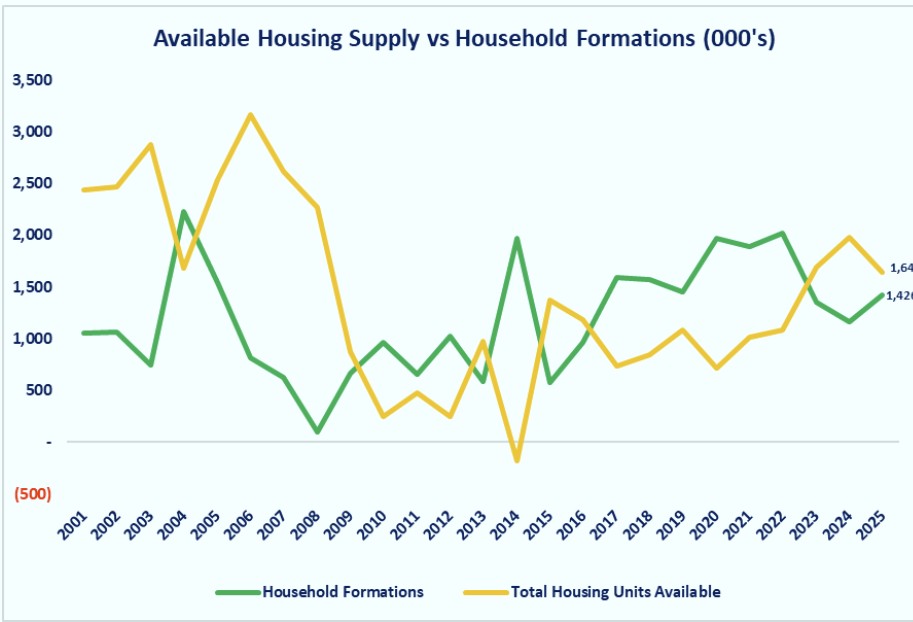
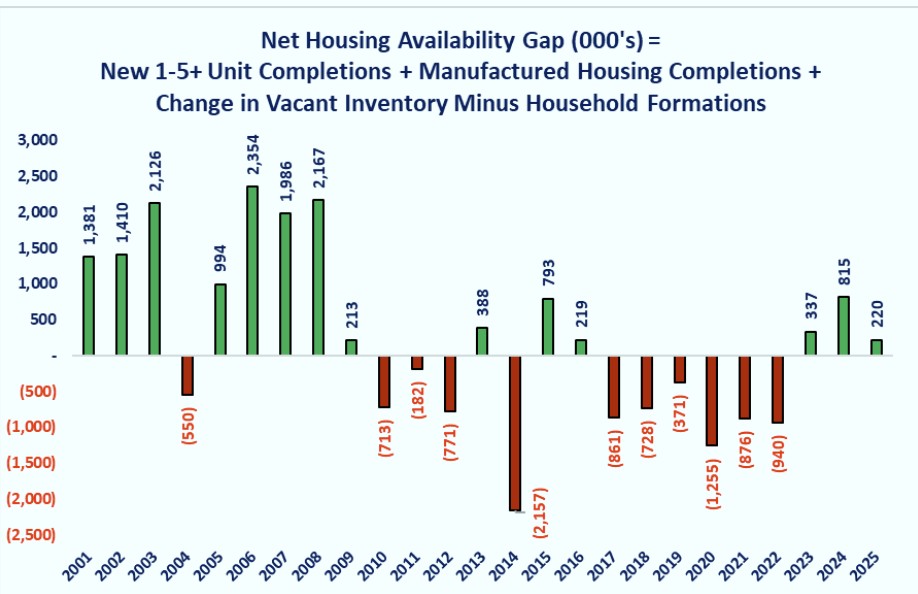
The last graph shows the Net Housing Availability Gap. The Net Housing Availability Gap is calculated by adding together all the sources of housing units that were discussed above and subtracting household formations. Green bars indicate a net surplus while a red bar indicates a shortage.
As you can see from the graph below, except for 2004, the Net Housing Affordability Gap was positive throughout the early and mid 2000's. This was thanks to a combination of the robust single-family housing unit completions and high levels of vacancies. When the GFC occurred, new construction fell and vacancies were absorbed. The other sources of housing units did not fill the gap and shortages developed. The Large Multi-Family category is the primary reason the Net Housing Availability gap went from a 1,255,000 deficit in 2020 to a surplus of 815,000 in 2024. The problem with Large Multi-Family is that it has a lagging response. Often projects are started when shortages develop, rents are rising, and interest rates are attractive. The risk is that by the time the project is completed, rent growth may have softened and financing costs may have risen,. This then causes new construction to slow. The pullback to 472,000 units in 2025 and the narrowing of the Net Housing Availability surplus may be evidence that new Large Multi-Family completions may be starting a phase of slowing.
From a macro level viewpoint, the Net Housing Availability Gap can be broken into four phases.
-
The pre-GFC recession boom phase with large cumulative surpluses.
-
The uneven post-GFC recovery phase from 2010 through 2016 with moderate cumulative shortages.
-
The consistent shortage phase from 2017 through 2022 with a large cumulative shortage.
-
The uncertain recovery phase since 2023 with small surpluses.
Conclusions
-
Single-family production cannot carry the burden of supplying sufficient housing units to meet household formation demands. The reality is that it never could but that was masked by the steep drop in household formation during the pandemic crisis.
-
The Large Multi-Family boom bought us time. The problem is that the boom-bust cycle is a cyclical response to a structural problem. If the trend that we are currently observing in Large Multi-Family production slowing continues, the shortage will return.
-
Manufactured housing should be considered the dark horse of the group for supplying housing units. If zoning, financing, insurance, and image barriers can be reduced or overcome, this category holds the potential to be a meaningful contributor to workforce housing supply.
-
The “housing crisis” is real and cannot be dismissed or ignored. What the data and graphs highlight is that the solution is not simply saying “we need to build more homes." The challenge is to get all stakeholders to understand the role of formation cycles, supply options and the often-underappreciated role of existing vacancy inventory.
-
Addressing housing supply and affordability is a problem that needs all stakeholders to come to the table with open minds to find solutions. The challenge is for everyone to be willing to move away from the “we can't” mentality because it has never been done before to a “why can't we?” mindset that is willing to explore all options, and be willing to take the risk of trying new ideas and solutions to solve the problem. While is great in theory, the challenge is how do you get all stakeholders on board with that concept? I do not have the answer, but I would suggest that the first step is to start face-to-face discussions among all stakeholders (municipalities, builders, neighborhood associations, and the actual buyer who is creating the demand).
Disclosures
This week's data is from the Census Bureau and the St. Louis Federal Reserve's FRED database.

Steve is the Economist for Washington Trust Bank and holds a Chartered Financial Analyst® designation with over 40 years of economic and financial markets experience.
Throughout the Pacific Northwest, Steve is a well-known speaker on the economic conditions and the world financial markets. He also actively participates on committees within the bank to help design strategies and policies related to bank-owned investments.