


Economic Summary
Consumer spending has been the engine driving US economic growth. For the past 25 years consumer spending has accounted for an average of 67.5% of total Gross Domestic Product (GDP). Last year it accounted for 68.1% of total GDP.
Perspectives
Soundbite
Discretionary consumer spending has averaged a 4.1% year-over-year growth rate since 2000. Last year it was 3.1%, indicating the consumer slowed their spending but did not drastically cut back. The underlying story over the past 25 years is the change in the composition of discretionary spending. Three themes emerge from analyzing the data.
-
Consumers have shifted more of their discretionary spending to digital spending.
-
Consumers are seeking value, efficiency, and convenience.
-
Consumers are spending on eating out versus preparing meals at home.
The data shows that the consumer is still actively spending on discretionary items but is being more selective and efficiently focused. Traditional big-ticket items (motor vehicles) and legacy formats (department stores) are suffering as a result. This has implications for states and municipalities for the part of their tax revenues tied to the sectors that are suffering, or if they have missed attracting businesses that participate in the above trends.
Analysis
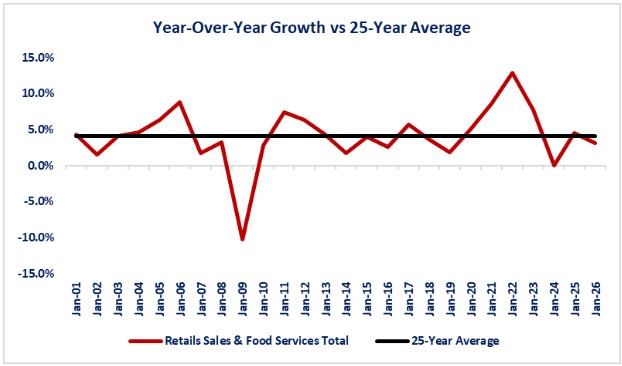
Let us start by examining the year-over-year growth of discretionary consumer spending. The graph below shows volatility in the growth. The 25-year average growth rate is 4.1%. Despite all the noise and uncertainty plus tariff impacts, the year-over-year growth as of 1/31/26 was still solidly positive, but slower than the 4.5% growth as of 1/31/26. Growth has been positive for all years except for two years.
-
1/31/08-1/31/09: -10.2%
-
1/31/23-1/41/24: 0.0%
Next, let us examine each of the sectors within the Census Bureau report to see where consumers are spending. Let us start by examining each sectors percentage of the total as of 1/31/00. At that time, the “Big 3” sectors were Automotive & Other Motor Vehicle Dealers, Grocery Stores, and Food Services & Drinking places. Simplistically stated, consumers were buying cars to go to buy groceries or to go out to eat and drink. Gasoline Stations, Department Stores, and Building Material & Garden Equipment Suppliers were the next three in ranking.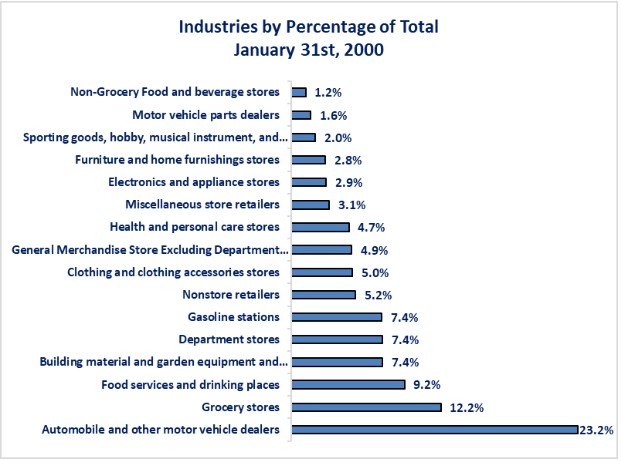
If we move forward 15 years, we see changes occurring beneath the surface. Even though the Big 3 remained unchanged, shifts were occurring. Two sectors experienced sizable declines in their share of total discretionary consumer spending while two experienced large gains. The biggest loser was the Department Stores sector as it suffered a 5.1 percentage point drop from 7.4% in 2000 to 2.3% in 2015. The Automobile & Other Motor Vehicle Dealers category experienced a 4.5 percentage point drop from 28.2% to 18.7%. The biggest winner was the General Merchandise Stores. With the growth of the “Big Box” retailers like Costco, Walmart and Target, consumers found it more efficient and convenient to do "one stop shopping"'. The Nonstore Retailers category was the second biggest winner as its share of the total rose by 3.6 percentage points from 5.2% to 8.8%. Consumers found it more efficient and often better value to buy online rather than in-store. The data also shows that one of the Big 3 gained share as the Food Services & Drinking Places sector increased from 9.2% to 11.6% of the total. 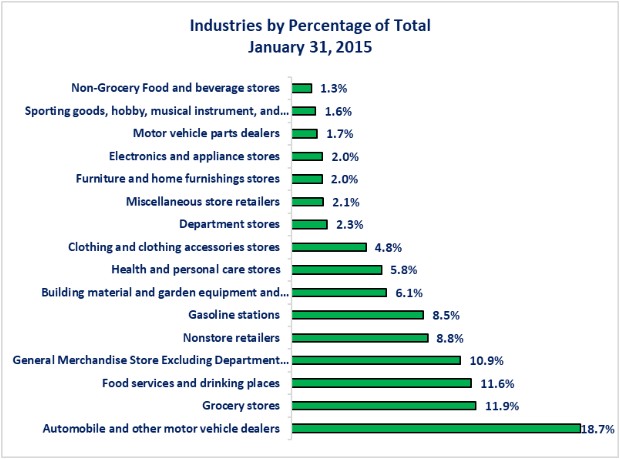
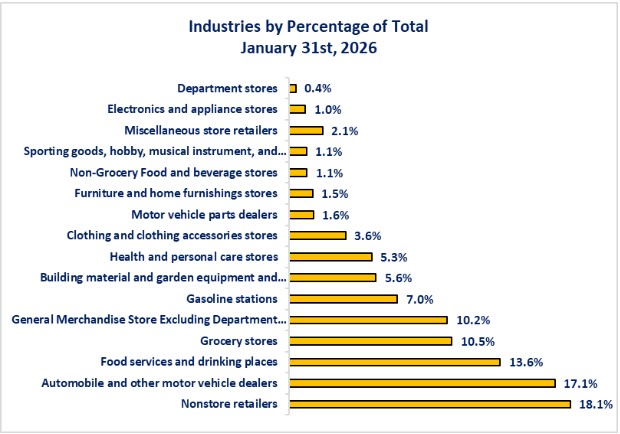
Finally, if we jump forward to current times (1/3/26) we see that the trends that were in place by 2015 continued and the Big 3 now has new leaders for two out of the three. The Nonstore Retailer category vaulted to the top spot as it improved by a total of 12.9 percentage points from 2000 to 2026. The loser from the advance was the Department Store category as it plummeted a total of 7 percentage points and it now comprises the smallest share of total discretionary consumer spending at 0.4%. The Automobile & Other Motor Vehicle category is still the second largest percentage of the total but has fallen 6.1 percentage points to 17.1% as of 1/31/26. The General Merchandise Stores (excluding Grocery Stores) category experienced the second biggest percentage point increase at 5.3 percentage points. This indicates that consumers continued to find better efficiency and convenience in “one stop shopping.” The Food Services & Drinking Places held onto third place and experienced a 4.4 percentage point increase since 2000. The fundamental shifts that appear to have occurred that caused the gains in these two categories are the consumer is focused on value, efficiency, and convenience. The other interesting development is the 4.4 percentage point increase in the Food Services & Drinking Places category. To gain a full picture of why this gain may have occurred it is important to consider the 1.7 percent point decline in Grocery Stores. What that would appear to indicate is two things.
-
Part of the increase is due to the rise of the younger generations spending on experiences (i.e., going out to eat and drink) versus the older generations who traditionally spend more on buying goods. The older generations may also be contributing to this shift as they are near or at retirement age and become more focused on experiences rather than buying more goods.
-
Part of the increase is due to the advent of the food delivery service gig economy (i.e., Uber Eats, Door Dash, etc.). It appears that a shift has occurred where more people find value and efficiency in the convenience of having someone else prepare their meals. The time savings of not going grocery shopping and preparing meals give them more time for experiences including more time with their children. This may be fine for the income earners that can afford food delivery method. What we are already learning in many cities is that as grocery stores close, the lower income households are negatively impacted. These households cannot afford food delivery and are now forced to travel further to buy the groceries, and in many cases find higher prices with the lack of competition.
Conclusions
- It would be premature to raise a red flag on discretionary spending simply because spending slowed over the last 12 months. Even with the slowdown, the year-over-year growth is not that far off the 25-year average.
-
The three major themes that have emerged over the past 25 years is that consumers are focused on efficiency/convenience, value, and experience.
- That has had a major impact on department stores and grocery stores. Online retailers, big box general merchandise stores (Costco, Walmart, Target, etc.), and restaurants and bars have benefited.
- That has had a major impact on department stores and grocery stores. Online retailers, big box general merchandise stores (Costco, Walmart, Target, etc.), and restaurants and bars have benefited.
-
The 25-year shift probably reflects the change in how different generations spend on discretionary purchases and the impact of technology.
-
The older generations grew up in a world where face-to-face, firsthand experiences were the normal way of shopping. This supported sectors like grocery stores and department stores.
-
The younger generations are “wired” to technology. I am not a sociologist but perhaps the younger generations are not comfortable with face-to-face and firsthand experiences with strangers because their normal form of interaction is virtual with their technological tools (i.e., cell phones, tablets, and computers). Home deliveries via online shopping or food delivery services may not only be more convenient and efficient, but they may also avoid needing to interact with strangers. Will that change as they age and start to build families? Only time will tell.
-
-
The fundamental shift that has occurred over the past 25 years has created an economic impact on many municipalities that have exposure to the traditional retailers that are being negatively impacted due to lost tax revenue.
The challenge that both businesses and municipalities face is whether they can adjust to the changing trends fast enough. One thing that we are learning is that with advances in technology, changes are happening far faster than in the past.
-
The additional challenge for municipalities is identifying their role in supporting the lifeblood of the municipality: small businesses. Big box retailers are not in every municipality; small businesses are.
- How do they support current small businesses to help them adapt?
- How do they attract new businesses that are participating in the new consumer spending model?
- How do they cooperate and coordinate with small businesses to support innovation that allows small businesses to adapt and maintain the tax revenue for the municipality (versus having the business close or leave)?
-
- One caution that we must remember is that the Census Bureau reports dollar sales, so the data does not give us a clear picture as to how much of the increased sales was volume driven versus price driven. Increases in volume create the potential for new jobs to meet the higher demand. Increases in prices do not. Even with this caveat, there is still value in the data when analyzing percentages of total sales for each industry since all are being compared on the same basis.
Disclosures
This week's data is from the Census Bureau's Advance Retail & Food Services Sales database.

Steve is the Economist for Washington Trust Bank and holds a Chartered Financial Analyst® designation with over 40 years of economic and financial markets experience.
Throughout the Pacific Northwest, Steve is a well-known speaker on the economic conditions and the world financial markets. He also actively participates on committees within the bank to help design strategies and policies related to bank-owned investments.