


Economic Summary
Housing
New home sales fell 17.6% in January due to the severe weather that occurred throughout the country. Mortgage applications fell 10.9% last week due to rising mortgage rates as the average 30-year mortgage rate rose from 6.19% to 6.30%. This caused applications to refinance to plummet 18.5%.
Inflation
The Producer Price index accelerated from a 2.9% year-over-year rate in January to a 3.4% pace in February. The Core Producer Price index rose from 3.5% to 3.9%.
Jobs
Initial jobless claims continued to remain in a range between 200,000 to 250,000 per week. Last week saw initial jobless claims fall 8,000 to 205,000. Unfortunately for those who are laid off, it is taking longer to find a job as continuing claims rose 10,000.
Manufacturing
Four out of the five manufacturing data releases were weaker than the month before. The New York Federal Reserve's manufacturing index fell to a negative 0.20 reading. Industrial Production slowed from 0.7% to 0.2% monthly growth. Manufacturing Production slowed from 0.8% to 0.2%. The Philadelphia Federal Reserve's manufacturing index provided the once piece of positive manufacturing data as its manufacturing index rose from a reading of 11.7 to 18.1.
Perspectives
Soundbite
Over the past 20 years, the economy's “center of gravity” for jobs and wages has shifted. It has been clearly documented and publicized that the economy has shifted to a service-oriented economy. What may be surprising to learn is that the Private Education & Health Services and Business & Professional Services sectors are the service-oriented sectors gaining ground while the Manufacturing and Retail Trade sectors are losing ground. As a result, the “center of gravity” for jobs creation is the Private Education & Health Services industry sector while the “center of gravity” for wages is the Professional & Business Services sector. One of the consequences of the shift has been a growing wage gap. The bifurcation that exists between the positive economic data and the negative consumer sentiment surveys may be partially or fully explained by the growing wage gap. This has implications not only for the economy but also for politics.
Analysis
Let us start by examining what percentage of the total each industry comprises for both wages and jobs. The earliest data available for wages from the Bureau of Labor Statistics (BLS) is 3/31/06, so the analysis will be just short of a 20-year analysis. The chart below illustrates that, as of 3/31/2006, the Private Education & Health Services industry sector made up the largest percentage of total jobs at 15.8%, while the Professional & Business Services sector made up the biggest percentage of total wages at 18.4%. There were four industries that had a smaller share of total wages compared to their share of jobs-Other Services, Leisure & Hospitality, Private Education & Health Services, and Professional & Business Services. These four industries have the lowest average monthly wage and thus, the reason why they contribute less to total wages than jobs. What this means is that, as of 3/31/06, 45.5% of total jobs in the US were in the four industries with the lowest pay. Because of the lower pay, these four industries only contributed 33.1% of the total wages.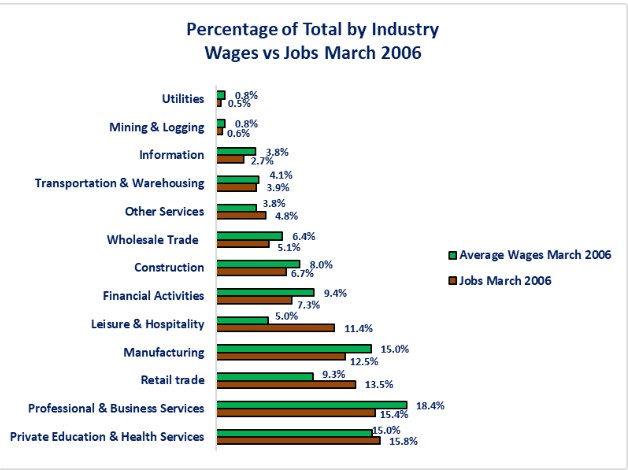
If we move forward to 1/31/2016, the data shows a growing trend in care services as represented by the Private Educations & Health Services industry sector. This sector's percentage of total jobs rose from 15.8% as of 3/31/2006 to 18.5% as of 1/31/2016. The second strongest growth was in high-value business services as represented by the Professional & Business Services industry. This industry saw its share of total jobs rise from 15.4% to 16.6%. Manufacturing experienced the biggest decline as its share of total jobs fell 2.3 percentage points from 12.5% to 10.2%. The Retail Trade sector experienced a decline from 13.5% to 12.9% which was a decline of 0.5 percentage points.
Examining the wage composition shows that the Professional & Business Services sector increased its lead in terms of percentage of total wages. This sector increased 2.6 percentage points from 18.4% as of 3/31/2006 to 20.9% as of 1/31/2016. Private Education & Health Services rose by 2.7 percentage points from 15.0% to 17.7%. It must be noted that the increase in Private Education & Health Services was due to a bigger increase in jobs relative to other sectors, not in wages. This industry sector remained in the bottom four for average monthly wage. The Manufacturing, Construction, and Retail Trade industry sectors experienced the biggest percentage point declines at 2.9, 1.3, and 1.2 percentage points respectively.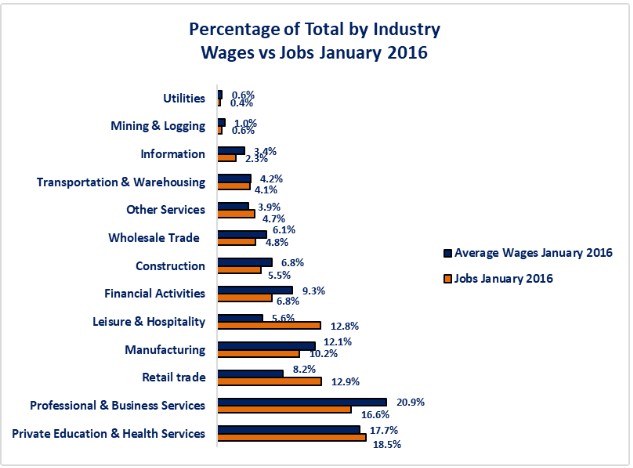
Moving forward 10 years to the current data as of 1/31/2026 shows how the Private Education & Health Services sector has become the “center of gravity” for the economy when it comes to jobs. This sector has grown from 15.8% of total jobs in 2006 to 20.5% in 2016. That is an all-time high for percentage of total jobs and is a total increase of 4.7 percentage points. The next closest industry was the Professional & Business Services sector. Its share of total jobs rose a total of 1.2 percentage points from 15.4% to 16.6%. The trend of decline continued for the Manufacturing and Retail Trade sectors. The percentage of total jobs for the Manufacturing sector fell from 12.5% in 2006 to 9.3% in 2026, which is a 3.2 percentage point decline. The Retail Trade sector experienced the second biggest percentage point decline at 1.0% from 13.5% to 12.5%.
On the wage side, the Professional & Business Services sector is the “center of gravity”. Its share of total wages has grown from 18.4% as of 3/31/2006 to 21.5% as of 1/31/2026 which is an increase of 3.1 percentage points. Private Education & Health Services rose from 15.0% to 19.0%. The biggest decline for percentage of total wages was in the Manufacturing. Its share of total wages fell from 15.0% to 10.6%, which is a 4.4 percentage point decrease. The Retail Trade industry was the second biggest loser as its share of total wages fell 3.5 percentage points from 9.3% to 5.8%. The percentage of total jobs in the four lowest paying industry sectors grew to 50.0%. 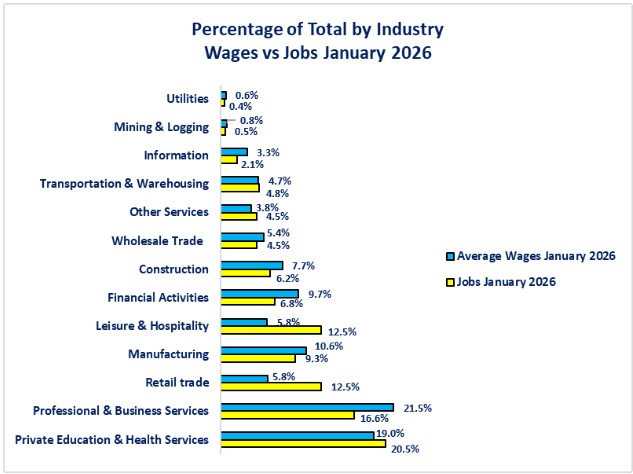
Finally, let us examine the wage gap. There are three ways that we can examine this gap. The first is to examine the difference between the lowest industry sector's average monthly wage versus the highest industry sector's average monthly wage. Using this method, we can see from the chart below that the gap has increased significantly over the past 20 years as the gap was $3,865.38 as of 3/31/2006 and is now $7,334.90 as of 1/31/2026. It is virtually impossible to envision a scenario where wages in the lowest paying industry sector (Leisure & Hospitality) sector are going to dramatically rise to narrow that gap. It is more of a risk that AI and robotics may eliminate the low paying jobs in the Leisure & Hospitality sector. Mathematically, that would narrow the gap from the elimination of the lowest paying jobs, but socially that would have a major impact given the fact the Leisure & Hospitality sector has 16,949,000 jobs.
The second method is to examine the difference between the average wage versus the lowest wage paying industry sector. The graph shows that the gap is much smaller but is still widening. That gap has grown from $1,665.43 to $2,907.15. The problem with this method is that the average wage will gradually come down if the lower paying industries continue adding more jobs than the higher paying industries. The desired scenario is for more jobs to be created that pay above the average to narrow the gap. The undesired scenario is for more low paying jobs being created that brings the average wage down and narrows the gap.
The third method is to examine the difference between the median monthly wage compared to the lowest wage. The median wage is the middle of the wages and does not involve calculating an average. Examining the graph below, you can see that, using this methodology, the gap is significantly lower than the high-low gap calculation but higher than the average gap calculation. This gap has widened from $2,248.11 as of 3/31/2006 to $3,941.73.
The message from the wage gap is that the bifurcation continues to grow between the higher wage earner sectors and the lower wage earner sectors. 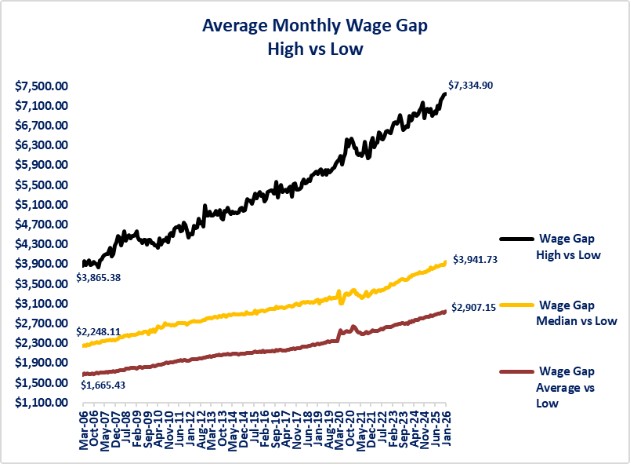
Conclusions
-
The private sector has shifted over the past 20 years when it comes to jobs and wages. The shift has been meaningful as care industries (Private Education & Health Services) and business services (Professional & Business Services) have gained share in both jobs and wages while manufacturing (Manufacturing) and retail (Retail Trade) continue to lose share.
-
With the growth of online sales, logistics (Transportation & Warehousing) is an industry sector to watch. It is one of only four industry sectors that showed an increase in share for both jobs and wages. Private Education & Health Services, Professional & Business Services, and Leisure & Hospitality are the other three.
-
-
Having one industry sector make up over 20% of total jobs is a risk for the economy. The aging of our population is a positive source of demand for this sector but changes to fiscal policy, especially as it relates to the growing federal deficit, represent a threat to the industry via reductions in government payments.
-
Having 50% of total jobs residing in the four lowest wage paying sectors is problem. More lower paying jobs means more people who are potentially struggling to pay their bills. The growing percentage of total jobs represented by the four lowest paying industry sectors probably accounts for some, if not all of the bifurcation between positive economic data and negative consumer sentiment surveys. Lower income wage earners are experiencing a different economic world compared to higher income wage earners.
-
History has shown when the gap between the “haves” and the “have nots” becomes severe enough, a revolution may occur.
-
For the US, the wage gap may be the source of the “haves” and “have nots” and the revolution could be in the form of a regime change in politics. Political science defines a regime change as a change in the political structure not just a change in leadership. A change in leadership is normally the first step in a regime change.
-
The fact that two major cities in the US (New York and Seattle) elected Socialist mayors should not be ignored. Consideration needs to be given as to whether these are anomalies or the initial signs of a revolution in our political system since a true political revolution creates threats and opportunities for businesses, individuals and the economy.
-
-
-
The Professional & Business Services sector is where the higher paying jobs are being created. Not only is this sector creating jobs, but they are also higher paying jobs as evidenced by the fact that this sector's percentage of total wages is increasing.
-
The Private Education & Health Service sector has the second largest share of total income. Unfortunately, this is not due to higher wages, since this sector is the fourth lowest paying industry sector. It is due to how many more jobs it is creating. Private Education & Health Services accounted for 46.1% of total jobs created since 3/31/2006.
-
-
The data showed us how the “center of gravity” for the economy has shifted over the past 20 years as it relates to jobs and wages. Demographics and technology will be major factors for where the “center of gravity” will be in the future. How it shifts remains to be seen.
Disclosures
All data for this week's edition comes from the Bureau of Labor Statistics.

Steve is the Economist for Washington Trust Bank and holds a Chartered Financial Analyst® designation with over 40 years of economic and financial markets experience.
Throughout the Pacific Northwest, Steve is a well-known speaker on the economic conditions and the world financial markets. He also actively participates on committees within the bank to help design strategies and policies related to bank-owned investments.