


Economic Summary
It was a mixed picture of economic growth this week as the number of positive versus negative results was essentially even.
Economic Growth
Real Gross Domestic Product (GDP) rose 2.0% on an annualized basis in the 1st quarter. Business spending on equipment and intellectual property products drove the increase as spending on efficiency, AI and data centers were the driving force. Consumer spending still accounts for the largest contribution to GDP. Consumer spending accounted for 69.2% of total GDP at the end of the 1st quarter.
Consumer Sentiment
The Conference Board's consumer sentiment index showed different results than last week's University of Michigan survey. The Consumer Sentiment Index rose from 92.2 in March to 92.8 in April.
Housing
Based on the results from both the FHFA and S&P/CS home price indices, home price growth slowed in February. The FHFA Home Price Index rose 1.7% year-over-year compared to 1.8% in January. The S&P/CS Home Price Index rose 0.9% compared to 1.2%. Mortgage applications fell 1.6% last week after rising 7.9% the previous week. This was all due to a decline in applications to refinance, which fell 4.4%. A slight rise in the average 30-year mortgage rate probably did not help. The rate rose from 6.35% to 6.37%. Applications to purchase rose 1.2%. Housing starts rose 10.8% year-over-year in March, driven by a 13.9% increase in multi-family starts compared to an 8.9% increase in single family starts. Building permits fell 7.4% with single family permits leading the way with a 7.9% decrease.
Inflation
The Personal Consumption Expenditures (PCE) index rose 3.5% year-over-year in March compared to 2.8% in February. The inflation index that the Federal Reserve watches is the PCE index excluding food and energy. This index rose 3.2% versus 3.0% in February. The Employment Cost index rose 0.9% in the 1st quarter of 2026 compared to a 0.7% increase in the 4th quarter of 2025. The wage component of the index rose 0.8% while the benefits component rose 1.2%.
Jobs
Initial jobless claims fell 26,000 last week with total initial claims equaling 189,000. For perspective, initial claims stood at 239,000 a year ago. Continuing claims fell 23,000 to 1,785,000. This total was 1,906,000 a year ago.
Leading Index
The Conference Board's Leading Index fell further in April. The index fell 0.6% after being unchanged in March.
Manufacturing
Durable goods orders rose 0.8% in March compared to a decline of 1.2% in February. Core durable goods orders rose 0.9% after rising 1.2% in February. The Dallas Federal Reserve's Manufacturing Activity index deteriorated further as it fell from -0.2 in March to -2.4 in April. The Richmond Federal Reserve's Manufacturing Activity index showed improvement as the index improved from zero to +3.
Personal Income
Personal income rose 3.7% in March. Unfortunately, most of that increase was eaten away once you factor in the impact of inflation. Real Personal Income (i.e., income after inflation) rose just 0.2%.
Personal Spending
The pace of spending continues to outpace income growth. Personal Spending rose 5.7% and after factoring out inflation, it still rose 2.1%.
Perspectives
Soundbite
Despite the headline narrative that the youth in the US are disconnecting and dropping out of the labor force, the data shows that the headline is not nearly as concerning once you understand the reason=the majority who are not in the labor force are in school for education or training.
The interesting story beneath the headlines is the story of the multi-decade decline in the male population in the labor force but rise of females. The category that should be monitored is not the total percentage not in the labor force, but the percentage that are not employed, or enrolled in school/training.
For those who love acronyms this category is called the NEET percentage. The good news about that category is that it is currently at 11.2%. This is down from 2005 and from the peak of 18.3% in 2010. The message from the data is that the majority of the youth in the US are not idly sitting at home. They are either working or in school/training.
Analysis
Before discussing the data, let us clarify the Labor Force Participation Rate (LFPR). The Bureau of Labor Statistics (BLS) defines the LFPR as the percentage of the civilian population that is either employed or unemployed. The civilian population excludes those who are in the military, incarcerated, or institutionalized and unemployed is defined as those who are actively seeking employment. Someone who is out of work but not actively looking for a job is not unemployed; they are out of the labor force.
Let us start by examining the LFPR by age groups. The three major age groups are:
-
16-24 years old
-
25-54 years old (often referred to as the prime working age group)
-
55 and over
As you can see from the first graph below, the 25 to 54-year age group has the highest LFPR at 83.5% as of 3/31/26. The LFPR for this age group is slowly rising. It is 0.9 percentage points above the 3/31/2005 level of 82.6%, has fully recovered the losses from the pandemic crisis, but is slightly below the high of 83.9% that existed as of 7/31/24. The 55 and over age group LFPR is currently at 37.9%. This is below its peak level of 40.5% as of 9/30/19. It has not recovered the losses from the pandemic crisis but is above the 36.4% level that existed as of 3/31/2025. The 16 to 24-year age group LFPR currently sits at 58.3%. This age group initially recovered the losses from pandemic crisis and set a new high of 61.1% as of 5/31/23 but has declined steadily since then. The current level of 58.3% is below the 59.0% level that existed 3/31/2005. This is the age group that has caught everyone's attention. As a result, let us examine this group.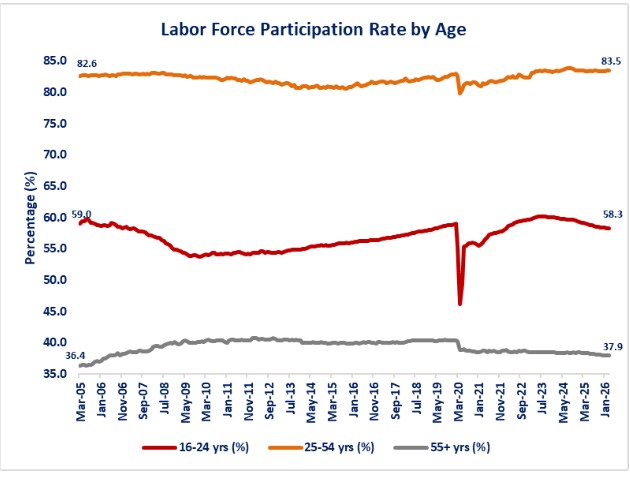
By breaking down the composition of the 16 to 24-year LFPR by gender the pattern remains the same but is more nuanced. The female portion of the 16 to 24-year LFPR is currently at 56.5%. This is below its peak level of 58.3% as of 5/31/23, but it is above the 3/31/2005 level of 55.7% and above the level that existed just before the pandemic crisis of 56.1%. The male portion of the 16 to 24-year LFPR is currently at 60.0%. This is below the 5/31/23 peak level of 61.8%, the pre-pandemic level of 61.1%, and the 3/31/2005 level of 62.2 %, The interesting trend is that the difference between the male and female rates has narrowed from 6.5 percentage points as of 3/31/2005 to 3.5 percentage as of 3/31/26.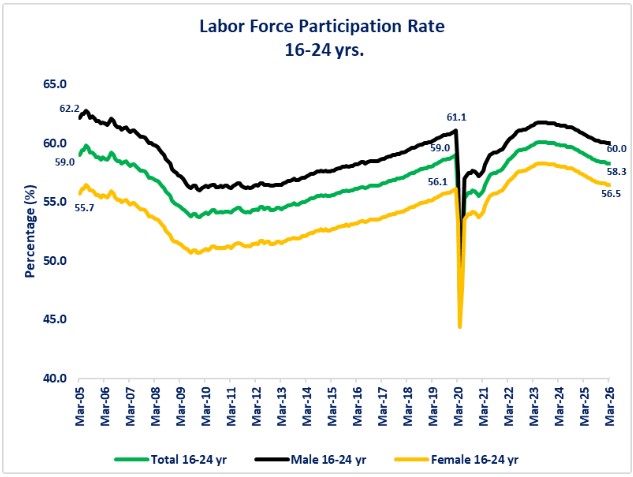
Since the LFPR is comprised of those employed and unemployed. let us take a closer look at the 16 to 24-year age group LFPR by the employed and unemployed and by gender. The first graph gives the positive message that over 50% (53.1%) of this age group is employed. The current story is that since the peak as of 5/31/23, the percentage has been declining. The explanation for the decline is most likely that the labor shortage created by the pandemic crisis and fiscal stimulus funds forced companies to raise pay, often significantly, to attract labor. This likely attracted youth who were not in the labor force to opt to get a job rather than go to school or training. Once the Federal Reserve started raising interest rates and the labor market weakened, it became harder to find a job and school/training became the more viable option. The male portion has declined more than the female portion as the difference between male and female employment has narrowed from 5.0 percentage points as of 3/31/2005 to 2.6 percentage points as of 3/31/2026.
The good news when examining the percentage of unemployed is that, although the trend is rising, it is well below the levels that existed as of 3/31/2005. Once again, the underlying story is that the gap has narrowed between male and female. The gap was 1.5 percentage points as of 3/31/2005 and is now 0.9 percentage points.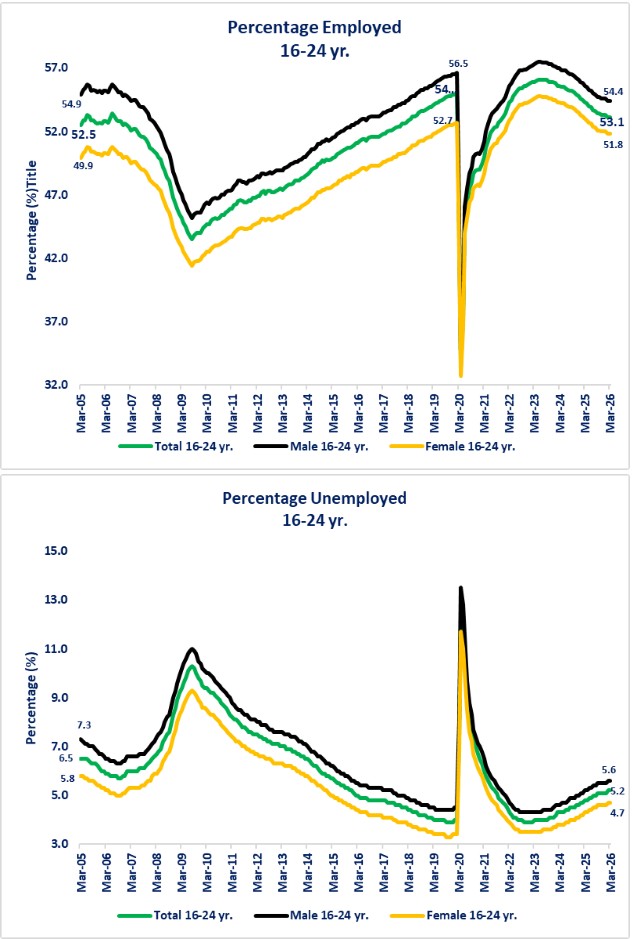
Now that we have gained a better understanding of the LFPR and its gender components (employed, unemployed), the natural question is what are the 41.7% of the 16 to 24-year-olds doing who are not in the labor force? The answer can be found in another data series that the BLS tracks. One series shows us what percentage of the 16 to 24-year-old civilian population is not employed but is enrolled in school for education or training. The one problem between the LFPR series and this series is that the LFPR series is seasonally adjusted while the second series is not seasonally adjusted. As a result, as you will see below, the not-seasonally adjusted is a series of swings up and down. This is primarily due to school seasons when people are in or out of school. The other problem is that because one is and one is not seasonally adjusted, the percentages will not sum to 100 if you try to add up the seasonally and non-seasonally adjusted data. That does not change the value of examining the data.
Let us start by examining the portion of the 16 to 24-year-old population that is enrolled in school but not working. The graphs show that, of the 41.7% of people not currently in the labor force, the primary reason is education/training. Since the data is not seasonally adjusted, if we take the average from 3/31/2005 to 3/31/2026 we see that the current level of all three at 35.9% (total), 16.4% (male), and 19.5% (female) is virtually unchanged from the long-term average of 35.9%, 16.3%, and 19.6%. The message from this data is that education/training is not displacing work at the margin; the two are co-existing. There is also a message that a consistently higher percentage of females is in enrolled than males. 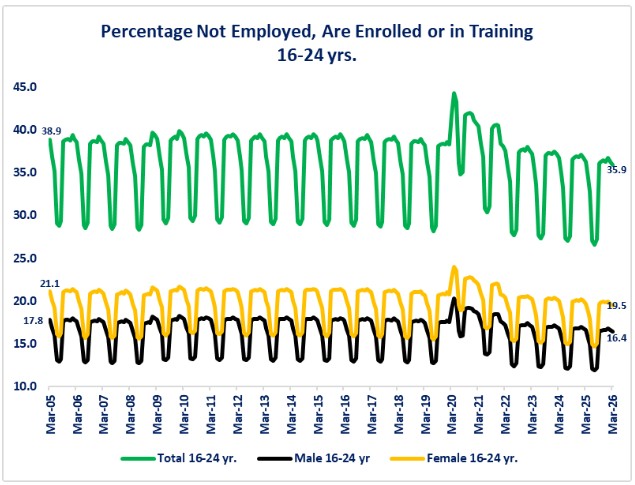
The last category to examine is those people who are not employed and not enrolled in education/training. Before casting stones on these people or classifying them as lazy, it is important to understand that there are multiple reasons why a 16 to 24-year-old person may not be employed and not enrolled in education/training. Some, but clearly not all reasons could be:
-
Personal health issues (physical or mental),
-
Staying home to take care of a sick family member,
-
Cannot afford childcare and must stay home to raise a child,
-
Unable to find work and have given up looking,
-
Lack of ability to get to work or school/training (poor public transportation, no private transportation available, cannot afford to pay for public transportation or a private vehicle),
-
They are displaced and/or unhoused, or
-
They perceive no reason to seek work or education/training because they can rely on someone else or social assistance to provide for their needs .
The good news is that this category makes up the smallest percentage of those who are not in the labor force and is trending down. Once again, the gap has narrowed since 3/31/2005 between males and females. The gap was 2 percentage points as of 3/31/2005 and now is 1.2 percentage points.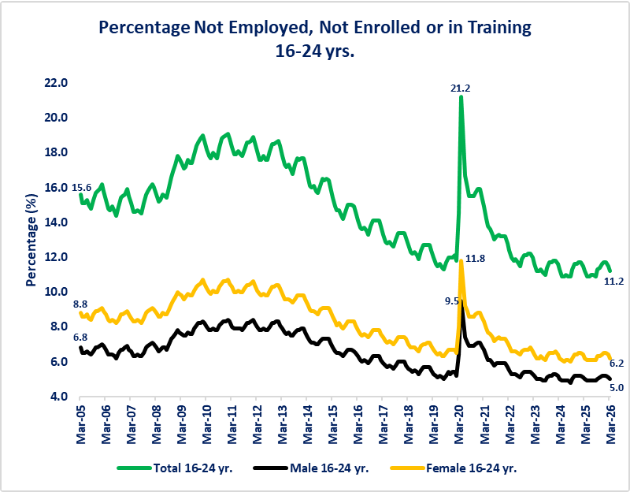
Conclusions
-
The headline story that the US is losing youth from the labor force is not as alarming as the high-level data might imply.
-
Enrollment in education/training is the dominant reason that explains the 41.7% of this population that is not in the labor force.
-
-
Even though the short-term story shows the LFPR falling from its peak, the long-term story shows that it has declined by less than one percentage point (0.9).
-
The rise after the pandemic crisis is more likely a story of a severe labor shortage that followed the pandemic crisis, luring younger people to forego or delay education/training and enter the labor market because of the high the wages that were being advertised and paid.
-
The decline since then may well be a normalization that has been spurred by a weakening labor market. When it becomes harder to find a job, pursuing an education/training becomes more attractive.
-
-
The one secular trend that should be monitored is the divergence between females and males in this age group.
-
Young women are closing the gap between their male counterparts when it comes to the LFPR. For companies trying to fill open positions, especially for traditionally male-dominated positions, perhaps the focus needs to shift to attracting females.
-

Steve is the Economist for Washington Trust Bank and holds a Chartered Financial Analyst® designation with over 40 years of economic and financial markets experience.
Throughout the Pacific Northwest, Steve is a well-known speaker on the economic conditions and the world financial markets. He also actively participates on committees within the bank to help design strategies and policies related to bank-owned investments.