


Economic Summary
It was a busy week for economic data capped off on Friday with the release of the widely anticipated jobs report.
Consumer Sentiment
Based on the preliminary results from the University of Michigan Consumer Sentiment Survey, consumers are becoming more pessimistic. The Consumer Sentiment Index fell from 49.8 to 48.2. This was driven exclusively by a deterioration in their view on current conditions. The Current Conditions sub-index fell from 52.5 to 47.8 as inflation was cited as the biggest issue. Sentiment improved modestly when it came to their expectations for the future as the Future Expectations sub-index rose from 48.1 to 48.5.
Housing
New home sales rose slowed slightly in March as sales increased 7.4% after rising 8.9% in February. A lack of existing home inventory continues to drive buyers to new homes. Mortgage applications fell further last week as mortgage rates crept higher. Applications fell 4.4% as applications to buy a house fell 3.7% and applications to refinance fell 5.0%. The average 30-year mortgage rate rose from 6.37% to 6.45%.
Inflation
Unit labor cost growth cooled to a 2.3% rate in the 1st quarter after rising 4.4% in the 4th quarter of 2025.
Jobs
ADP reported a 109,000 increase in jobs in April compared to a 61,000 increase in March. The Bureau of Labor Statistics reported a 115,000 increase in jobs for the month of April. It also made revisions to the previous two months that resulted in a net downward revision of 16,000. The unemployment rate remained unchanged at 4.3% while average weekly earnings rose 3.6% year-over-year. The Department of Labor reported a 10,000 increase in weekly initial claims for unemployment benefits. Total initial claims remain at the bottom of the 200,000 to 250,000 range that has existed since 2023 as total claims were 200,000 last week. Total continuing claims fell10,000 to 1,766,000. The Challenger announced layoff report showed a 20.9% year-over-year decline in announced layoffs.
Manufacturing
Factory orders increased 1.5% in April compared to 0.3% in March.
Service Sector
S&P Global reported an increase in its service sector PMI. The index rose from 49.8 to 51.0. The ISM non-manufacturing PMI showed slightly different results as its index fell from 54.0 to 53.6.
Trade Balance
The nation's trade deficit widened from -$57.8 billion in February to -$60.3 billion in March. Exports totaled $320.9 billion while Imports totaled $381.2 billion.
Perspectives
Soundbite
Since 3/31/21 all industries have experienced positive jobs growth, but two industries-Healthcare & Social Assistance and Leisure & Hospitality-account for 51.6% of total jobs growth.
Perhaps an explanation for why consumer sentiment surveys are at or near record lows is the fact that 70.3% of the Healthcare & Social Assistance jobs and 99.7% of the Leisure & Hospitality Jobs have average weekly earnings below the national average.
This group of people are most likely being hit the hardest when prices rise and are potentially under financial stress. Since the US is adding more of these lower paying jobs than higher paying jobs, it is likely that the consumer sentiment surveys are picking up more of these people in their survey.
Analysis
Let us start at the macro level and get a picture of where jobs were added over the last five years.
As you can see from the graph below three industries-Information, Mining & Logging, Utilities-barely added any jobs over the last five years, while two industries-Leisure & Hospitality and Health Care & Social Assistance-accounted for 51.6% of total jobs added.
The problem is that the three industries that barely added jobs are the three highest paying industry sectors while the two industries that added over half of the jobs are in the bottom four. As of 2/28/26, average weekly earnings in the US were $1,278.40.
Health Care & Social Assistance is the 4th lowest paying industry at $1,051.87 and Leisure & Hospitality is the lowest paying industry at $594.30.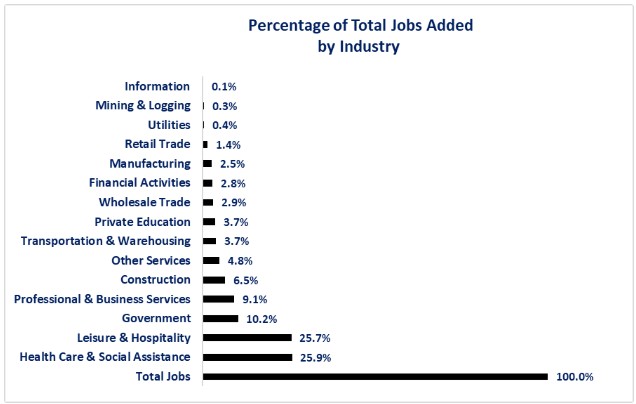
The macro view tells us what industries created the most jobs, but it does not provide any insight into what job categories within the industries were the source of the job creation.
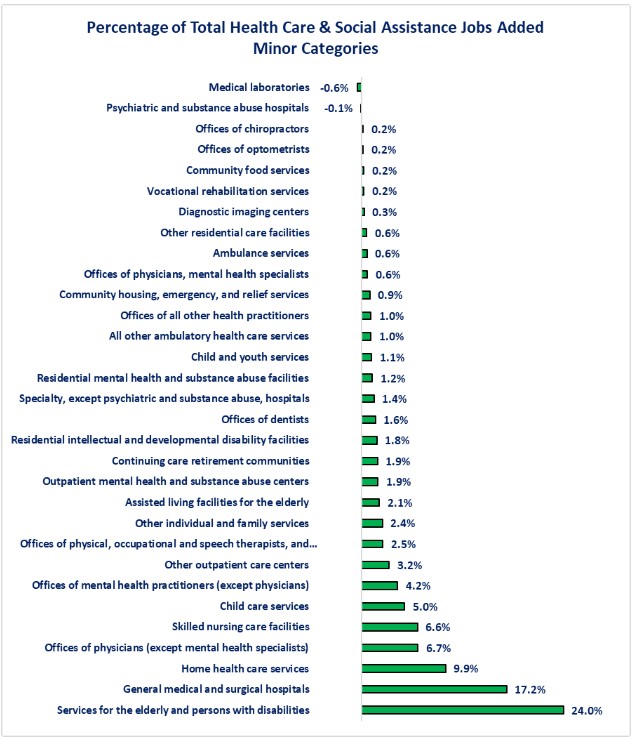
Let us examine the details of jobs creation within the two industries that added the most jobs over the past five years. Since Health Care & Social Assistance led jobs creation, let us examine that industry first. There are several observations worth noting.
-
Jobs growth was concentrated in three job categories: Services for the Elderly & Persons with Disabilities, General Medical & Surgical Hospitals, and Home Health Care Services. These three job categories accounted for 51.1% of total jobs added in the Health Care & Social Assistance industry.
-
The Services for the Elderly and Persons with Disabilities category was, by far, the biggest source of jobs growth in the Health Care & Social Assistance industry as it accounted for 24.0% of total Health Care & Social Services jobs added.
-
The Medical Laboratories and Psychiatric & Substance Abuse Hospitals job categories lost jobs over the past 5 years.
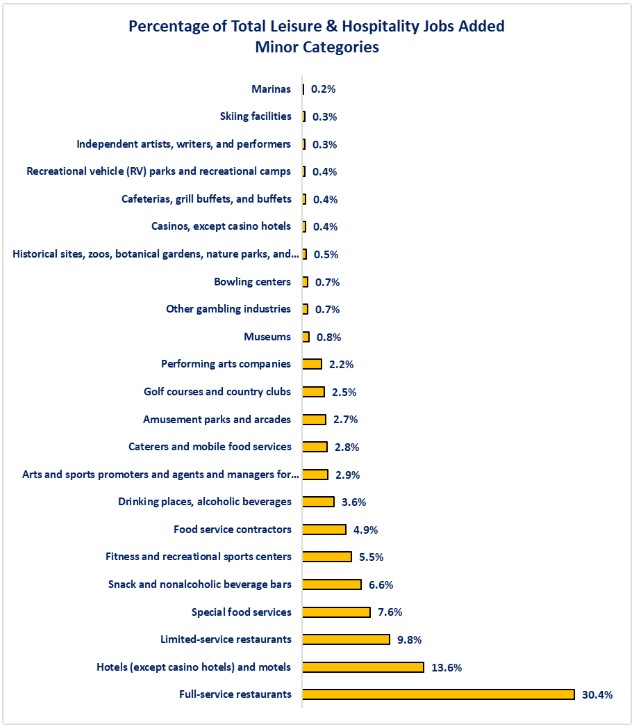
Now let us examine job categories within the Leisure & Hospitality industry. Two observations worth noting:
-
The source of jobs growth is even more concentrated than the Health Care & Social Assistance industry. The Full-Service Restaurants job category accounted for almost a third of total jobs added over the past five years.
-
Three job categories-Full-Service Restaurants, Hotels (except casino hotels) & Motels, and Special Food Services-accounted for 53.8% of total jobs added in the Leisure & Hospitality industry since 3/31/21.
The logical next question is “what kind of wages do the industry categories pay?” Digging into the Bureau of Labor Statistics (BLS) data answers that question.
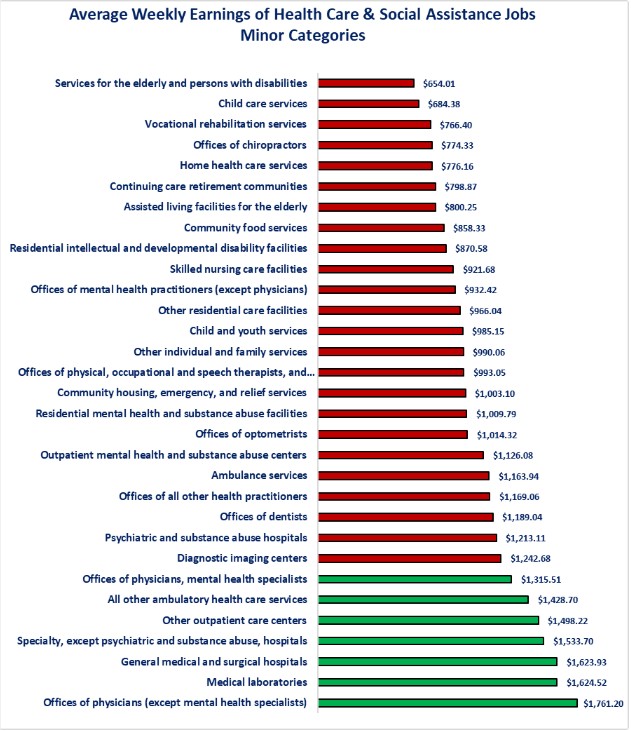
In the graph below, red represents job categories with average weekly earnings below the national average. Let us start with the Health Care & Social Assistance industry again. The following data stands out:
-
The job category that added the most jobs since 3/31/21-Services for the Elderly & Persons with Disabilities-is the lowest paying job category for the Health Care & Social Assistance industry. The average weekly earnings for this job category are $654.01.
-
There are seven job categories that have average weekly earnings above the national average.
-
One job category-General Medical & Surgical Hospitals-was the second highest industry category for adding jobs and is the third highest category for wages.
-
The six remaining highest paying job categories only made up 11.7% of total jobs, combined.
-
The remaining 24 job categories have average weekly earnings below the national average, and they account for 70.3% of total Health Care & Social Assistance jobs added since 3/31/21.
-
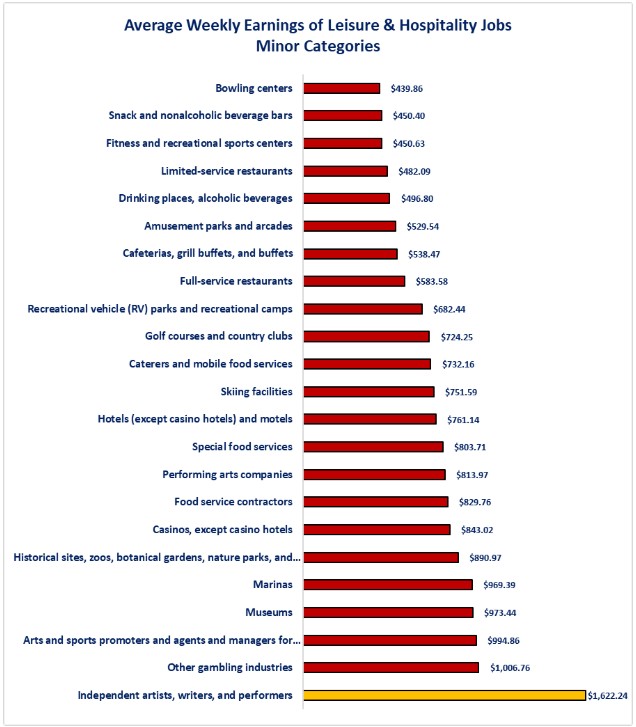
Finally, let us examine the Leisure & Hospitality industry average weekly earnings by job categories. Once again, red denotes job categories with average weekly earnings below the national average.
The story is starker for this industry when it comes to average weekly earnings. All job categories except one have average weekly earnings below the national average. The only job category above the national average is the Independent Artists, Writers and Performance job category.
Conclusions
-
All industries added jobs over the past 5 years but the difference between the slowest and fastest job creating industries was stark.
-
The bottom three industries accounted for less than 1% (0.9%) of total jobs added while the top two industries accounted for 51.6% of total jobs added.
-
-
From the average workers' viewpoint, the problem is that we are creating jobs in industries that have average weekly earnings below the national average.
-
The jobs category with the strongest jobs growth for the Health Care & Social Services industry was the Services for the Elderly & Persons with Disabilities category.
-
With the aging of the Baby Boomer population and advances in technology to extend life expectancy, these jobs will most likely continue to grow as demand for these services grows.
-
-
Full-Service Restaurants was the jobs category within the Leisure & Hospitality industry with the strongest jobs growth.
-
So far, within the current economic cycle, people are still going out to eat.
-
-
From a risk perspective, having concentration in something increases risk. This is no different for jobs.
-
If growth remains concentrated in two industries, the US economy is vulnerable because if something happens that slows or stops jobs growth in one or both industries, all else being equal, the economy will suffer.
-
-
The fact that most new jobs creation are happening in the lower paying industries may help explain the divergence in economic data versus consumer sentiment.
-
It is the upper income households that are driving the economy via their spending while it is the lower income households that are driving jobs creation.
-
As more lower-paying jobs are created, it is likely that more of the people working these jobs will be captured in the consumer sentiment survey. Their view of the economy may be far more pessimistic than what the economic data is showing us.
-
-
Your trivia information for today is:
-
The highest paying job (based on BLS data) is the Fossel Fuel Electricity Generation job at $2,965.83 per week.
-
The lowest paying job is the Snack & Non-Alcoholic Beverage Bar job at $450.40 per week.
-
There are only 75,300 Fossel Fuel Electricity Generation jobs as of 2/28/26 while there are 1,008,700 Snack & Non-Alcoholic Beverage Bars jobs.
-

Steve is the Economist for Washington Trust Bank and holds a Chartered Financial Analyst® designation with over 40 years of economic and financial markets experience.
Throughout the Pacific Northwest, Steve is a well-known speaker on the economic conditions and the world financial markets. He also actively participates on committees within the bank to help design strategies and policies related to bank-owned investments.