



Economic Summary
It was another steady stream of economic data released this week with a mix of both positive and negative results.
Consumer Sentiment
The University of Michigan released the final results of its Consumer Sentiment Survey. The results showed a further decline in consumer sentiment. The Consumer Sentiment Index fell from 48.2 in April to 44.8 in May. The Current Conditions sub-index fell from 47.8 to 45.8 and the Future Expectations sub-index fell from 48.1 to 44.1.
Housing
The positive news was that building permits rose 5.8% led by a 22.7% increase in multi-family permits. Single family permits rose 2.6%.
The negative news was a 2.3% decline in mortgage applications, driven by a rise in the 30-year mortgage rate. The average 30-year mortgage rate rose from 6.46% to 6.56%. Applications to buy a home fell 4.1%, while applications to refinance fell 0.1%. Housing starts fell 2.8% in April, with the decline centered in single family housing starts, as they fell 9.0% while multi-family starts rose 14.3%.
Jobs
The positive news is that the Department of Labor reported a decline of 3,000 people applying for initial unemployment benefits. Initial claims fell from 212,000 to 209,000. For perspective, initial claims were at 225,000 for this time last year.
The negative news is that continuing claims rose 6,000 to 1,782,000. Continuing claims were 1,889,000 this time last year.
Leading Index
The leading index brought surprising positive news as it rose 0.1% in April. Forecasts were for a -0.1% decline. The strength in the stock markets was the major force in generating a positive result.
Manufacturing Activity
The positive news is that S&P-Global reported improvement in its manufacturing activity index. The index rose from 54.5 in April to 55.3 in May.
On the weaker side, the Philadelphia and Kansas City Federal Reserve Banks both reported declines. The Philadelphia Federal Reserve reported a steep decline in its manufacturing activity index. The index fell from 26.7 in April to -0.4% in May. The Kansas City Federal Reserve reported a much smaller decline as its index fell from 10 to 9.
Service Sector Activity
S&P-Global reported a decline in service sector activity, as its index fell from 51.7 to 50.9. This still indicates growth but it is occurring but at slower pace.
Perspectives
Soundbite
The Business Trends and Opportunities Survey (BTOS) highlight the reality that size still matters when it comes to how small businesses did over the past year. As of May 3, 2024, the story is that small business owners are more positive about the company’s performance but still face the challenge of rising prices and an inability to fully pass on those price increases. The net result is a large percentage of small businesses are experiencing a decline in operating revenue/sales/receipts as higher prices slow down sales.
Analysis
This week’s Perspectives section will examine four survey questions from the BTOS report.
-
Prices paid by the business over the past two weeks.
-
Prices charged by the business over the past two weeks.
-
Change in operating revenue/sales/receipts over the past two weeks.
-
For brevity, operating revenues/sales/receipts will be called revenues for the remainder of the newsletter.
-
Current assessment of the business’s performance.
-
The analysis will examine the net percentage for each question. Net percentage means netting out the difference between positive and negative responses. For three of the questions this will mean subtracting the “Declining” responses from the “Increasing” responses. For the performance question this will mean adding the “Excellent” and “Above Average” responses and subtracting the “Below Average” and “Poor” responses.
Let us start by examining the results from the survey question: “Over the last two weeks, how did the prices that this business paid for goods or services change?” As you can see from the graph below, all business sizes are reporting rising prices paid on a net basis. The net percentage was trending lower in the 4th quarter of last year but has since shown a steady trend higher for all small business sizes. It remains to be seen if the decline as of the most recent survey date (5/3/26) is temporary or the start of a new downward trend.
What is interesting is that the percentage does not rise sequentially by size. By that I mean, that you might think the smaller the business size, the larger the percentage reporting an increase, since they have more limited supply chain options compared to bigger companies. As you can see from the graph below, that has not been the case over the past year. Currently, the smallest company size category (1-4 employees) and biggest (100-249) have the two smallest net percentages. Companies with 5-9 and 10-19 employees consistently have the highest net percentage.
If we examine what the percentage point change in the net percentage was from 4/20/25 (shortly after tariffs were announced) and from 2/22/26 (shortly before the war started) we discover that, although the 100-249 company size category consistently has the lowest net percentage, it has experienced the largest percentage point increase for both periods. Currently, all company size categories have a net percentage of 40% or higher. 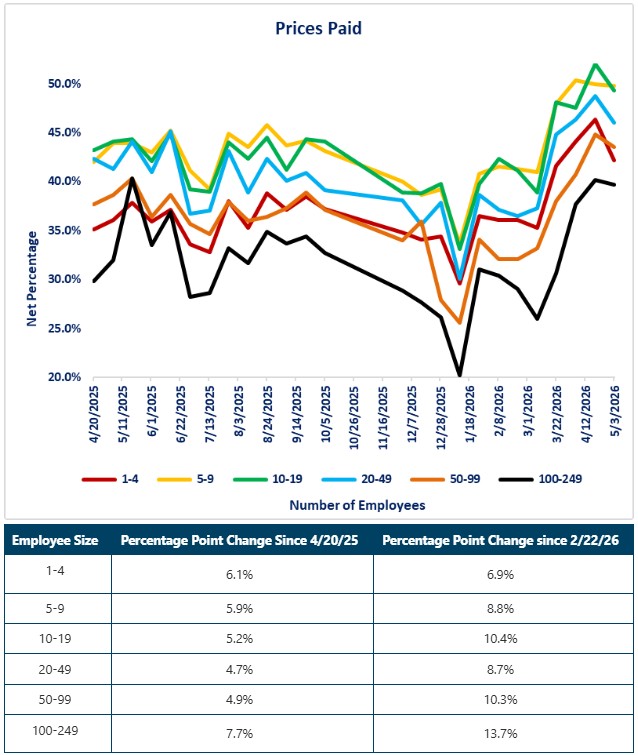
Now let us examine the responses for the question: “In the last two weeks, how did the prices this business charges for its own goods or services change?” We see the same pattern as the prices paid category where price increases were trending lower in the 4th quarter of last year and then were trending higher this year until recently. The current decline in the net percentage is steeper than the decline in prices paid.
Examining the percentage point change reveals that the two largest company size categories have a smaller percentage of respondents raising their prices since 4/20/25. All company sizes, except the largest, have a higher percentage of respondents raising prices since 2/22/26.
What immediately jumps out from the graph below is that, even at the peak, less than 20% of respondents reported price increases on a net percentage basis. The important message is that when 40% or more of small businesses are paying higher prices while less than 20% are raising prices, which implies that small businesses do not to have the pricing power to fully pass through price increases to offset rising prices paid. 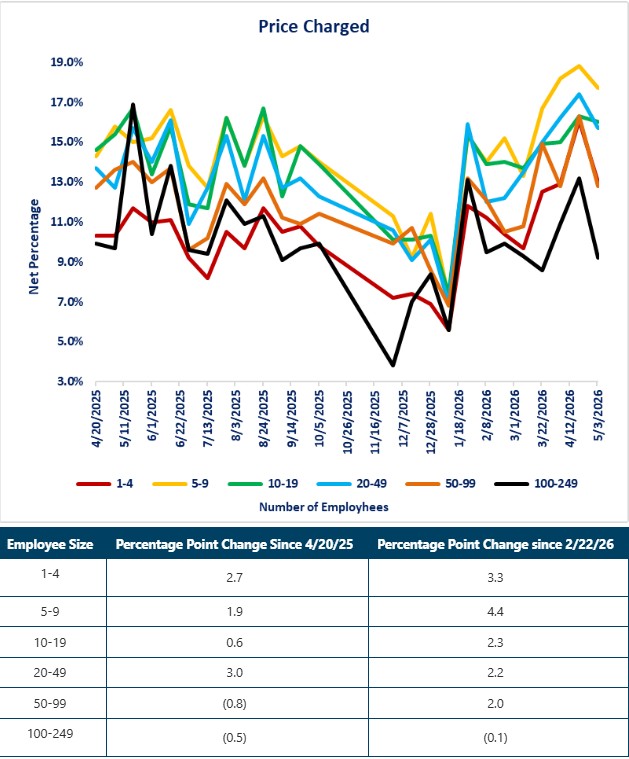
Examining the data for responses to the question: “Over the last two weeks, how did this business's operating revenues/sales/receipts change?” helps reveal why a smaller net percentage of small businesses are raising prices. The story that seems to have played out is the following:
-
Small businesses were hit with price increases for the goods or services that they purchase.
-
Small businesses tried to raise prices to offset the increased expense.
-
Customers reduced purchases due to price increases.
-
Revenue fell.
-
Small businesses were forced to back off on price increases.
The important information derived from the responses to this survey question is that the net percentage is still negative even though there has been improvement since 4/20/25. That means that a larger percentage of small businesses are reporting revenue declines than increases. That is a different result than the positive earnings increases being reported by the large publicly traded companies.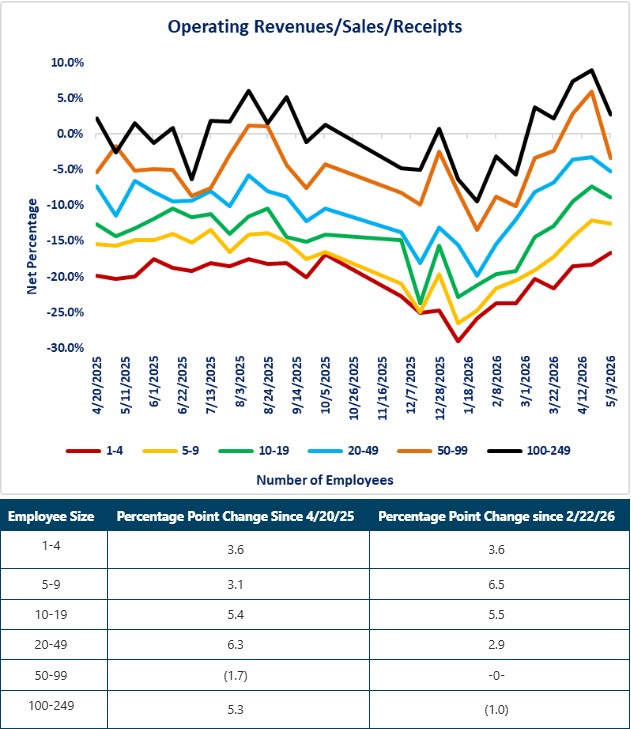
The final question that will be examined is: “Overall, how would you describe this business's current performance?” This question is a subjective question compared to the first three being objective questions. This question is closer to a business owner sentiment question since qualitative and quantitative factors along with emotions help determine how a business owner views their business's performance.
Size matters based on the responses to this question, as the largest company size category consistently has a higher percentage rating their performance positively compared to the smaller companies. As of 4/22/25 the gap between the biggest and smallest was 29.6 percentage points. As of the May 3 survey, that gap has marginally improved to 28.8 percentage points. The smallest company size category had a net positive percentage of 0.7% as of the 4/22/25 survey and it has now improved to 5.9%. That compares to the largest company size category starting at a net positive percentage of 30.3% and now improving to 34.7%. Where the gap changed was from 2/22/26 until 5/4/26. The smallest company size category is 1.7 percentage points higher now compared to 2/22/26, while the largest company size category is 4.4 percentage points lower. Whether this is the start of a trend for the gap to continue narrowing remains to be seen.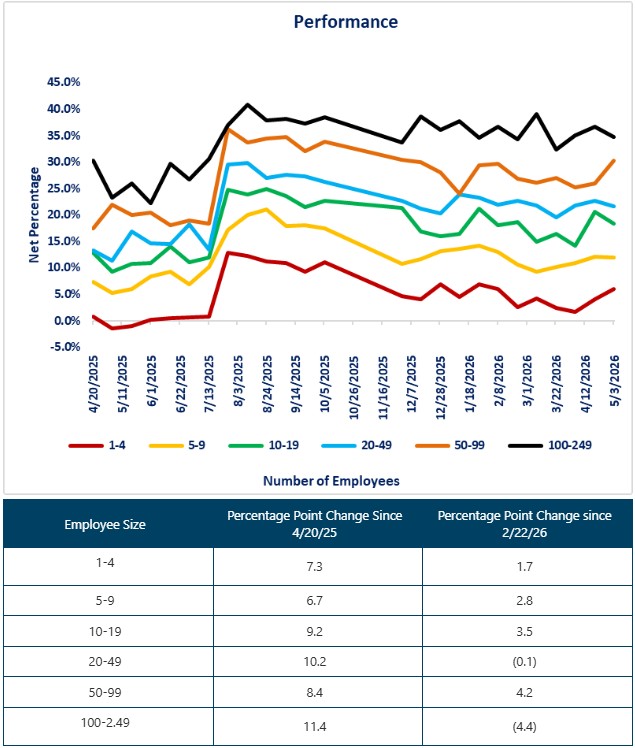
Disclosures

Steve is the Economist for Washington Trust Bank and holds a Chartered Financial Analyst® designation with over 40 years of economic and financial markets experience.
Throughout the Pacific Northwest, Steve is a well-known speaker on the economic conditions and the world financial markets. He also actively participates on committees within the bank to help design strategies and policies related to bank-owned investments.