


Economic Summary
This week's slew of economic data releases tilted to weaker results as most of the economic data was weaker than the month before.
Consumer Confidence
The Conference Board reported a further decline in consumer confidence in May as its Consumer Confidence Index fell from 93.8 to 93.1. The decline was not as severe as the University of Michigan results, but the trend is the same for both: declining.
Economic Growth
The Bureau of Economic Analysis made its first revision to its initial estimate for Gross Domestic Product (GDP). The second estimate shows GDP grew slower than originally estimated. 1st quarter GDP was revised from the original estimate of 2.0% to 1.6% on a quarterly annualized basis. On a year-over-year basis the revision was far smaller as growth was revised from 2.7% to 2.6%. A downward revision to intellectual property products spending drove the downward revision.
Housing
Mortgage applications fell 8.5% last week with all of the decline occurring in applications to refinance. Applications to purchase a house were unchanged from the week before, but applications to refinance fell 18.1%. A continued rise in the average 30-year mortgage rate was the culprit. The average 30-year mortgage rate rose from 6.56% to 6.65%. Higher interest rates also resulted in a decline in new home sales. New home sales fell 6.2% in April after rising 3.4% in March. A 25% decline in the Midwest drove the decline and three out of the five regions of the US experienced declines.
Inflation
The Personal Consumption Expenditures (PCE) price index rose 0.4% for the month of May and 3.8% on a year-over-year basis. Core PCE rose 0.2% in May and 3.3% year-over-year.
Jobs
Initial jobless claims rose 5,000 last week as 215,000 people applied for initial unemployment benefits. Continued claims rose 15,000 to 1,786,000.
Manufacturing
The Richmond Federal Reserve's manufacturing activity index rose from a +3 level in April to +13 in May. Durable goods orders rose 7.9% in April. When you exclude defense and transportation orders core durable goods orders 1.1%.
Personal Income
Rising inflation chewed up any gains in personal income as real personal income (income after inflation) fell 0.4% in April and fell 1.2% year-over-year.
Personal Spending
Even with negative income growth, real personal spending rose 0.1% in April and rose 2.1% year-over-year. Consumers drew down their savings to continue spending as the personal savings rate fell from 3.2% in March to 2.6% in April.
Perspectives
Soundbite
After the COVID pandemic crisis shutdown, high-propensity applications to form a new business surged. This was most likely due to the stimulus money provided as well as low financing costs, The good news is that, over the past two years, high-propensity business applications have remained at higher levels than what existed prior to the pandemic crisis, and the trend is rising. Although we do not have current data on the conversion ratio for a high-propensity application to become a business, the message remains that, despite the current challenging times for small businesses, the entrepreneurial spirit is alive and well.
Analysis
Before discussing the data, definition of the data is warranted. The Census Bureau tracks business applications to form a new business. It provides the following definitions.
-
A business application is an application for an Employer Identification Number (EIN) made predominantly for business purposes.
-
A business formation is defined as the formation of an employer (wage-paying) business from a business application.
-
A high-propensity business application is an application with a high-propensity turning into a business with a payroll. The identification of high-propensity applications is based on the characteristics of applications revealed on the IRS Form SS-4 that are associated with a high rate of business formation.
Let us start by examining monthly high-propensity business applications from July 2004. We can see that applications trending higher between July 2004 and December 2006. A steady decline occurred during the 2007-2009 recession and then began an uneven but steadily rising upward trend until the end of 2019. The pandemic crisis and subsequent fiscal and monetary stimulus created a distortion as application initially plummeted, then soared, only to gradually settle back.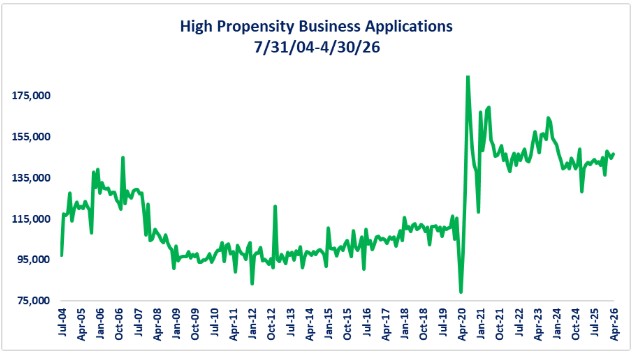
You can see high distortion that resulted from post-pandemic fiscal and monetary stimulus on the chart above. What may get lost is the results once the fiscal and monetary stimulus were removed. The chart below is the same as the first chart except it excludes the data during the stimulus surge and subsequent unwind. The point of the graph is to highlight how high-propensity business applications have remained significantly higher than levels that existed before the pandemic crisis hit. The average monthly high-propensity business application before the pandemic crisis was 106,697. The average for the past two years is now 142,137.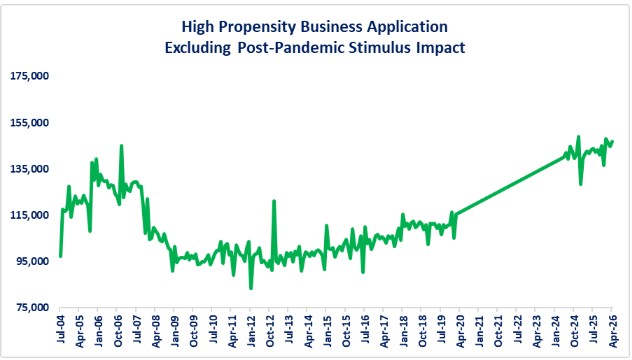
If we carve out the last two years from the above graph, we can see that not only are the absolute levels above the pre-pandemic levels, but the trend rising overall. The message that may get lost in the news headlines is that the entrepreneurial spirit is alive and well. This appears to fit the adage that out of chaos and uncertainty comes opportunities. The high-propensity business applications seem to be signaling that people are seeing opportunities and forming new businesses to take advantage of the opportunities. Headlines regularly highlight how technology and AI are eliminating jobs. What they are not highlighting is that new businesses and jobs are being formed. This may help explain how the headlines are regularly reporting announced layoffs but the initial claims for unemployment benefits are not rising. Perhaps people who have been laid off took the event as the motivation to form a new business and thus did not file for unemployment benefits since they were not actively looking for a new job.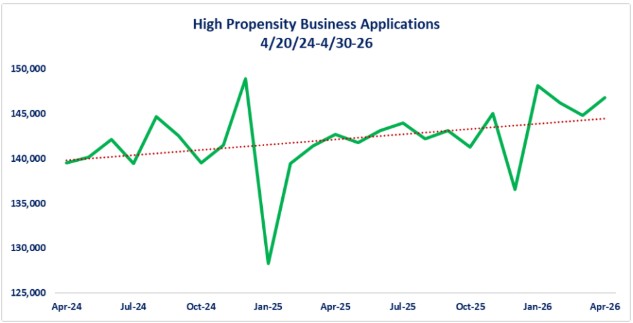
The natural question that may come up is “what percentage of those high-propensity business applications actually converted to a business?” The Small Business Association (SBA) tracks this data with two caveats:
-
The most recent data ends as of 12/31/21.
-
The Census Bureau's definition of a business is an employer based (wage paying) business, so, there may well be single-person small businesses that are not captured in the formation data.
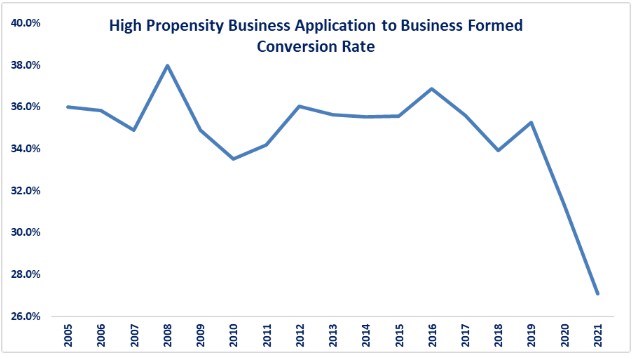
The graph below shows the conversion rate for a high-propensity business application to become a business. The average conversion rate was 34.7% from 2005 through 2019. Then we see a decline when the pandemic crisis hit in 2020. A possible explanation for this is that it was due to the surge in high-propensity business applications that was illustrated in the first graph. A lot of that surge may have been people who, because of the fiscal and monetary stimulus provided, decided that now was the time to try and start their own business and control their own destiny. As a result, they may have (figuratively) dipped their toes into the new business waters and applied to form a business. Then economic reality may have set in as they learned what it really took to form and run a business. Since the economy was re-opening and existing businesses were offering high salaries to attract employees back into the workforce, the idea of running their own business may have lost its appeal and they went back to working for someone else. Even with the drop in the conversion ratio, there were still over 25% (27.1%) of the applications that resulted in a wage-paying business. We do not yet know if the conversion rate has returned closer to the level that existed before the pandemic. We do know that applications are at a higher level so a conversion rate below 35% may still create more businesses than what was occurring at the end of 2019. An illustration of this is as follows:
-
There were 116,456 high-propensity applications as of 12/31/19. The conversion rate was 35.3% which means 41,077 new businesses were formed.
-
There were 146,782 high-propensity business applications as of 4/30/26. To create 41,077 jobs (like 2019) would mean a conversion rate of 28%. Anything above 28% would mean more jobs were created than the 2019 level even if the conversion ratio is below the 35.3% level of 2019.
Closing Thoughts
-
A new, and higher level of high-propensity business applications has been sustained over the past two years. This is the opposite of what happened when the 2007-2009 recession hit.
-
Although not considered a leading indicator for recessions the results at least provide perspective on the current business environment.
-
-
The layoffs that are happening within technology and other skilled industries may have freed up talent that is now pursuing using their skills to run their own business.
-
This may help explain why the initial claims for unemployment have not been rising as layoff announcements increase.
-
-
The data on high-propensity business applications provides evidence that, despite the current challenges facing small businesses, the entrepreneurial spirit lives on.
-
For those who want to see real life examples of new and innovative small businesses being formed, there is a website for you. It is called the Rational Optimists Society and its link is below.
Disclosures
-
The application data for this week's Perspectives section came from the Census Bureau's Business Formations report as of 4/30/26.
-
The business conversion rate came from the Small Business Administration's Office of Advocacy's data through 12/31/21.

Steve is the Economist for Washington Trust Bank and holds a Chartered Financial Analyst® designation with over 40 years of economic and financial markets experience.
Throughout the Pacific Northwest, Steve is a well-known speaker on the economic conditions and the world financial markets. He also actively participates on committees within the bank to help design strategies and policies related to bank-owned investments.