


Summary
Contrary to the report issued by ADP yesterday (33,000 jobs lost) the Bureau of Labor Statistics (BLS) reported jobs grew by 147,000 in June. The BLS also revised up the previous two months. April was revised up from 147,000 to 158,000 and May was revised up from 139,000 to 144,000. This resulted in a net upward revision of 16,000 jobs. The unemployment rate fell from 4.2% to 4.1% but the labor force participation rate fell from 62.4% to 62.3%. Wage growth cooled as average weekly earnings slowed from a 4.1% year-over-year rate in May to 3.4% in June. For those wanting the Federal Reserve to lower its overnight borrowing rate, June's employment data will not support those wishes.
Establishment survey.
Although June was another solid month for jobs growth, the growth was extremely concentrated. Growth in government jobs accounted for almost half (48.3%) of total jobs growth. The growth in government jobs was all at the state and local level as federal jobs fell by 7,000. The top two industries for jobs growth (Government and Healthcare) accounted for 89.3% of total jobs growth. 40% of the industries lost jobs.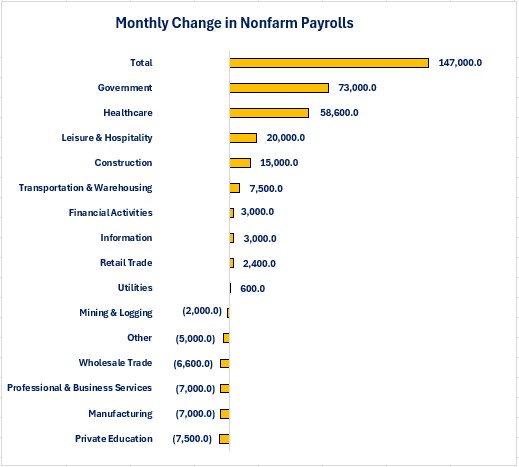
For the average worker, average weekly earnings growth slowed from 4.1% in May to 3.4% in June. Information showed the strongest wage growth at 5.8% while Mining & Logging had the slowest growth at 1.4%. 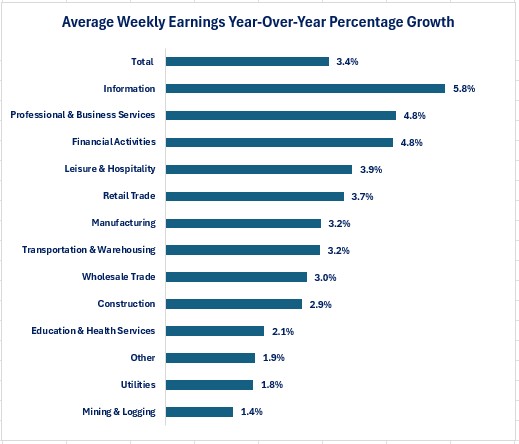
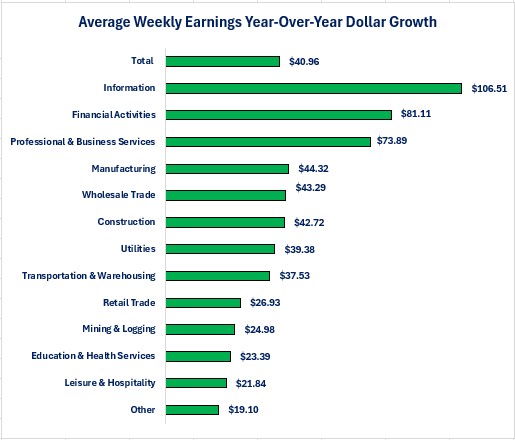
On a dollar basis, the Information industry also had the highest dollar growth in wages as its average weekly earnings increased by $106.51 per week over the past year. The Other Services industry experienced the smallest dollar increase at $19.10 per week. The gap between the highest paying industry and the lowest grew in June.
-
The Utility industry pays $2,186.52 per week compared to the Leisure & Hospitality's weekly wage of $580.89. That is a gap of $1,606.63 per week compared to the gap being $1,588.09 in May.
-
This is another reminder that headline data does not necessarily reflect accurate economic conditions for all workers.
Household survey.
The Household Survey did not reflect as many people becoming employed compared to the Establishment Survey's jobs growth. The Household Survey reported a 93,000 increase in the number of people becoming employed. The good news is that it reported a 222,000 decrease in the number of people becoming unemployed. The unwlecome news is that the labor force fell by 130,000 and the number of people who are not in the labor force grew by 329,000. The increase in the people who are not in the labor force cannot be blamed on people retiring because the people who are not in the labor force but state that they want a job grew by 544,000. This highlights the story that has been occurring in 2025: companies may not be laying off a lot of people but, if you do get laid off it is becoming harder to find a new job. This can be seen in the data for people who were already unemployed.
-
The average duration of unemployment rose from 21.8 weeks in May to 23.0 weeks in June.
-
The percentage of people unemployed for 27 weeks or more grew from 20.4% to 23.3%.
Education mattered when it came to the unemployment rate as the lower your education the higher the unemployment rate and the higher the increase in the unemployment rate.
-
Less than a high school diploma: Unemployment rate rose from 5.5% to 5.8%.
-
High school graduate, no college: Unemployment rate fell from 4.5% to 4.0%.
-
Some college or associate degree: Unemployment rate fell from 3.3% to 3.2%.
-
Bachelor's degree or higher: Unemployment rate fell from 2.6% to 2.5%.
The average hourly worker is not experiencing the same results as higher paying salaried jobs.
-
Their average work week fell from 34.3 hours to 34.2 hours.
-
The number of people working part-time due to economic reasons rose by 1,000, driven by slack work or business conditions.
-
The percentage of the workforce that is working multiple jobs grew from 5.3% to 5.4%.
Conclusions.
-
The nation continues to create jobs at a steady pace but, the jobs growth is highly concentrated in a few industries.
-
People who do lose their job are finding it harder to find a new job.
-
Wage growth slowed but still remained solid on average. Unfortunately, the gap between the highest paid and lowest paid workers grew.
-
The employment report does not support the argument for lowering interest rates. With core inflation continuing to be closer to 3% than 2%, and jobs growth remaining steady, it is most likely that the Federal Reserve will continue to hold its overnight borrowing rate steady for now.
Content Authenticity Statement:
The Economic Update newsletter is comprised entirely of the expertise, thoughts, perspectives, and opinions of the author with no use of generative AI. Data is sourced from the original providers (typically government agencies) and analyzed by the author.

Steve is the Economist for Washington Trust Bank and holds a Chartered Financial Analyst® designation with over 40 years of economic and financial markets experience.
Throughout the Pacific Northwest, Steve is a well-known speaker on the economic conditions and the world financial markets. He also actively participates on committees within the bank to help design strategies and policies related to bank-owned investments.