


Summary
The Bureau of Labor Statistics released the data for May's employment situation. From a job's perspective, the nation continued to add jobs but at a slightly slower pace than last month. 139,000 jobs were added in May compared to 147,000 in April. It was also slightly slower than the 12-month average of 149,000. From an employment perspective, there was a 696,000 decrease in the number of people employed but, only a 71,000 increase in the number of unemployed. The rest of the decline in employment was due to other factors (i.e., retirement, medical, staying home to care for family members, etc.). The unemployment rate remained unchanged at 4.2%.
Establishment survey.
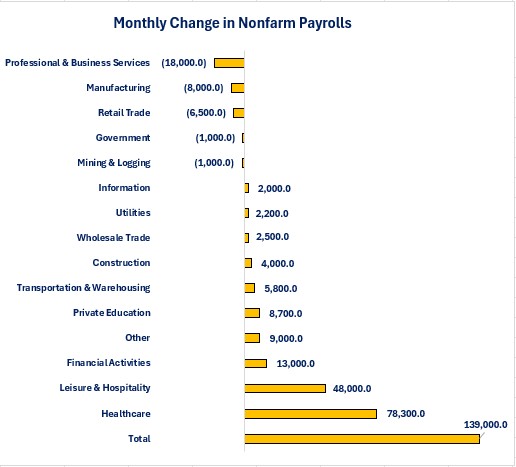
Although the headline data shows continued jobs growth, the data beneath the headlines was far more mixed. Essentially, all of the jobs growth occurred in two industries: Healthcare and Leisure & Hospitality. Those two industries accounted for 91% of total jobs growth and of those two industries, Healthcare accounted for 56% of total jobs growth. As the chart below shows, five industries lost jobs while ten industries added jobs. Professional & Business Service was the leader for job losses as this industry lost 18,000 jobs.
The average worker saw their average monthly earnings rise at a 4.1% year-over-year pace. The Information Services sector experienced the highest year-over-year growth rate at 6.8% while the Utilities sector experienced the slowest growth rate at 1.3%.
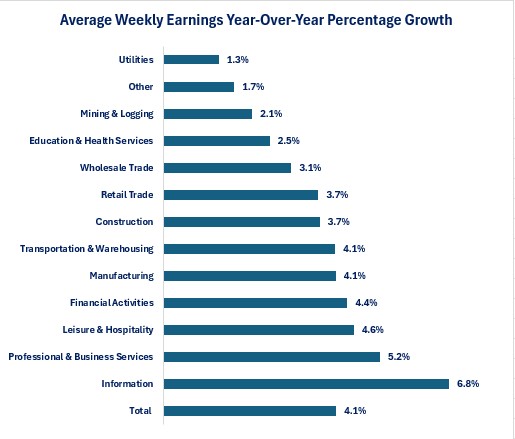
On a dollar basis, the average worker in the Information Services sector received an increase of $123.60 per month while a worker in the Other Services industry only received a $17.30 monthly increase.

The average worker did not receive any additional income via more hours worked as the average workweek remained unchanged at 34.3 hours.
Household survey.
Once again, a large divergence occurred between the Establishment Survey for number of jobs created versus the Household Survey for number of people employed. The Household Survey reported a 696,000 decrease in the number of people employed. The number of people reporting they were unemployed only rose by 71,000 while the rest of the people who were no longer employed fell out of the labor force. This could be for one of two reasons:
-
They retired and were no longer looking for work.
-
They chose not to look for work. This could be because they decided to go back to school to obtain more education, they were unable to look for work (medical, caring for family members, etc.) or they chose not to look for work.
The decline in the number of people who were employed was concentrated in those with full-time jobs as the number of people employed in full-time jobs fell by 623,000. The number of people working multiple jobs rose by 150,000 and the number of people working multiple jobs as a percentage of total employed remained unchanged at 5.2%. The burden of working multiple jobs continued to be carried by women.
-
The number of men working multiple jobs rose by 8,000 from 4,144,000 in April to 4,152,000 in May but, their percentage of total employment fell from 4.9% to 4.8%.
-
The number of women working multiple jobs rose by 142,000 from 4,208,000 in
April to 4,350,000 in May and their percentage of total employment rose from 5.5% to 5.7%.
For those who were already unemployed the data showed improvement. What the data does not tell us is whether the improvement is from people finding work or because they hit their 27-week limit for benefits and dropped out of being counted as unemployed.
-
The average duration of unemployment fell from 23.2 weeks to 21.8 weeks.
-
The percentage of people who have been unemployed for 27 weeks or more fell from 23.5% to 20.4%.
Conclusions.
The Employment Situation report provided a mixed bag of results. On the surface, the data shows jobs growth is slowing. Beneath the surface we learned that jobs growth was highly concentrated in two industries.
May's employment data will most likely not cause the Federal Reserve to change the “wait and see” approach to monetary policy.
Content Authenticity Statement:
The Economic Update newsletter is comprised entirely of the expertise, thoughts, perspectives, and opinions of the author with no use of generative AI. Data is sourced from the original providers (typically government agencies) and analyzed by the author.

Steve is the Economist for Washington Trust Bank and holds a Chartered Financial Analyst® designation with over 40 years of economic and financial markets experience.
Throughout the Pacific Northwest, Steve is a well-known speaker on the economic conditions and the world financial markets. He also actively participates on committees within the bank to help design strategies and policies related to bank-owned investments.