


Summary
The US added 115,000 jobs in April. Even with a small downward revision to the previous two months, the nation has now added over 100,000 jobs in three out of the four months this year.
Jobs growth remains concentrated as the Health Care & Social Assistance industry sector accounted for 47% of the total net jobs growth. Ten industries added jobs and five lost jobs, while the unemployment rate remained unchanged at 4.3%.
Whether businesses are moving out of the “low hiring” mode remains to be seen, but the increases this year are encouraging compared to last year. The jobs data supports the Federal Reserve's decision to keep its overnight borrowing rate unchanged.
Establishment Survey
We continue to see the pattern of bifurcated growth as ten industries added jobs and five lost jobs. The Health Care & Social Services industry sector continues to be the source of strength for jobs growth as it added more jobs than the next two fastest industry sectors combined.
The concern remains that concentration creates risks. For April, Health Care & Social Assistance accounted for 47% of total net jobs growth. The risk is if something happens to this industry sector, the economy will suffer. On the positive side, with the aging of the Baby Boomer generation, demand for health services should remain positive.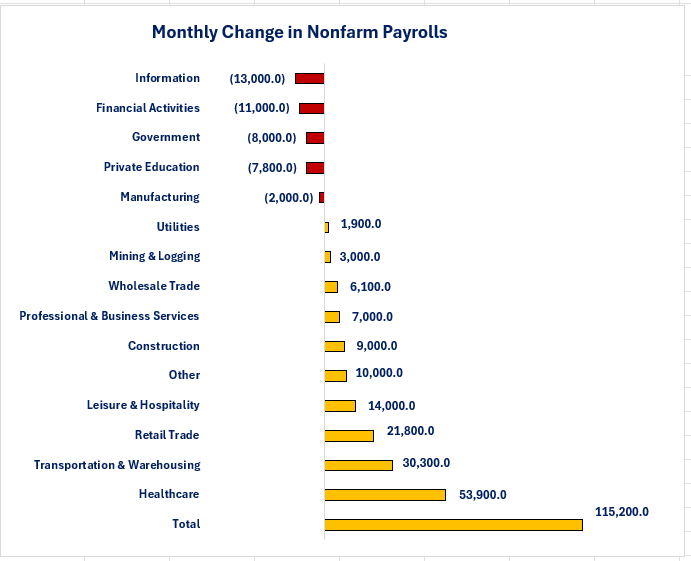
The graph below shows the percentage of total jobs that each industry sector comprises at the end of April. The Health Care & Social Services sector continues to make up the biggest percentage at 15.0% with Government jobs not far behind at 14.7%. The Mining & Logging and Utilities sectors comprise the smallest percentage of total jobs at 0.4% each.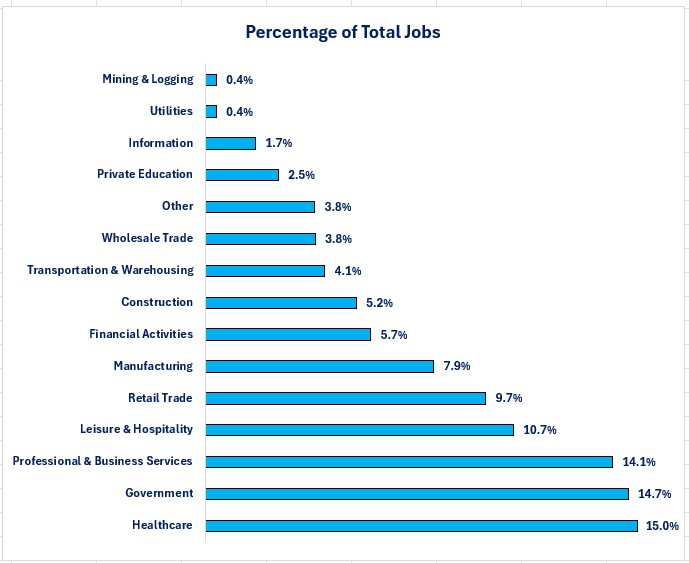
From a wage standpoint, the average worker experienced a 3.6% year-over-year growth in their average weekly earnings. They also benefited from the fact that the average work week increased from 34.2 hour to 34.3 hours. The graph below shows that wage growth varied widely between industry sectors.
The industry sector that added the most jobs (Education & Health Services) experienced the lowest earnings growth at 1.9% while the industry sector that added the least amount of jobs (Utilities) experienced the highest wage growth at 8.3%, 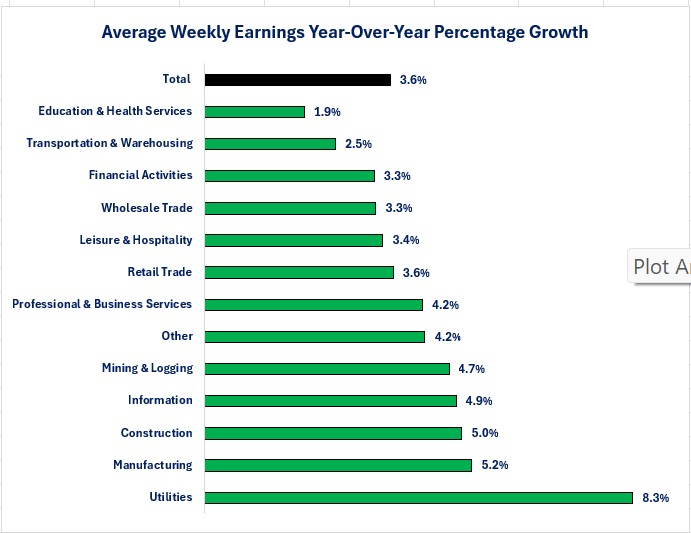
Examining wage levels highlights the vast gap between the lowest average weekly earnings ($600.78) for the Leisure & Hospitality sector versus the highest weekly earnings ($2,351.92) for the Utilities sector.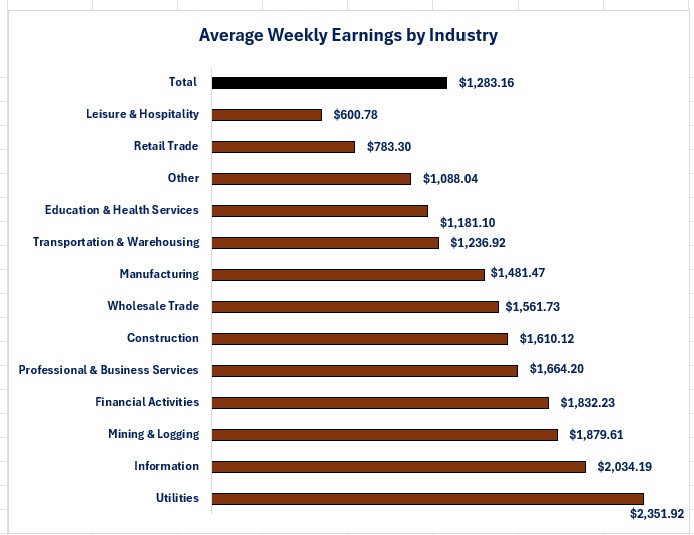
Let us now examine what the Household (People) Survey reveals.
Household survey
The Household Survey once again deviated from the Establishment Survey as the Household Survey showed a 226,000 loss in the number of people employed. The labor force declined by 92,000 and the number of unemployed people rose 134,000. The net result is that the labor force participation rate fell from 61.9% to 61.8%. The unemployment rate remained unchanged at 4.3%.
Examining the composition of employment shows that full-time employees fell 424,000 while part-time employees rose 116,000. A larger percentage of employed people are working multiple jobs as the percentage of total employed who are working multiple jobs rose from 5.1% to 5.2%.
For those already unemployed, the data improved slightly. The average duration of unemployment fell from 25.3 weeks to 24.4 weeks and the percentage of people unemployed for 27 weeks or more fell from 25.4% to 25.3%. Given the decline in the labor force, it appears that the improvement was due to long-term unemployed people dropping out of the labor force.
Conclusions
-
It is encouraging to see jobs growth above 100,000 for three out of the four months this year. Whether the “jobs growth blues” are over remains to be seen since revisions will occur with next month's data.
-
Even though jobs growth is over 100,000 the reality is that 47% of those jobs are in the Health Care & social Services industry.
-
A possible explanation for the poor consumer sentiment surveys is the fact that the jobs growth is happening in industries that are at the lower end of the pay scale. These people most likely have a far more pessimistic view of the economy if they are struggling to make ends meet. The recent rise in food and energy prices hits the lower income households harder than the upper income.
-
April's employment data support the Federal Reserve decision to hold its overnight borrowing rate unchanged at its last meeting.

Steve is the Economist for Washington Trust Bank and holds a Chartered Financial Analyst® designation with over 40 years of economic and financial markets experience.
Throughout the Pacific Northwest, Steve is a well-known speaker on the economic conditions and the world financial markets. He also actively participates on committees within the bank to help design strategies and policies related to bank-owned investments.