




Changes in US Consumer Finances: Wealth Grows but Stress Also Grows
The Federal Reserve conducts a survey of households every three years to identify changes in consumer finances. This is a more comprehensive study compared to simply examining individual components of consumer finances. The survey includes five major categories:
- Income
- Assets
- Debt
- Net Worth
- Financial Vulnerability
Soundbite
When measured on an inflation-adjusted (real) basis, American families experienced an increase in purchasing power, but financial stress also became more visible between the 2022 and 2025 survey. Real median income rose 6.9% while median net worth increased 2.3%. Underneath that positive news was the fact that median liquidity (cash) balances fell, average credit card balances rose and the percentage of families reporting late loan payments jumped from 12.2% to 19.6%. If you were a homeowner, you maintained a clear wealth advantage over those who did not own homes, while some less wealthy groups lost ground. The message from the data is:
- The growth in income and wealth was not universal.
- Growing wealth (i.e., your assets) does not necessarily mean that it is easier to pay your monthly bills (i.e., your income).
Analysis
Note: Each survey is collecting data from the year before. For example, the 2025 survey gathers results from 2024. Although not “real time,” this is the most recent data and still gives us information and insights regarding trends.
Throughout this analysis, the data will reflect the median result. The median reflects the middle of all the data points and avoids the potential distortions from using the mean (average). The average gives each family equal weight and can be distorted by outliers (i.e., very high income or low income). As a result, significantly higher incomes in the top percentiles will raise the average even though the number of these households may be small. The median simply identifies where the middle is for all households surveyed.
Income
Let us start by examining the income results.
As you can see from the chart below, the trend for real family income is steadily rising. You can clearly see the drop after the 2007-2009 Financial Crisis recession and then the resumption of the rising trend. From the 1989 survey through the 2025 survey, median real family incomes rose 26.9%, and between the 2022 and 2025 surveys it rose 6.9%.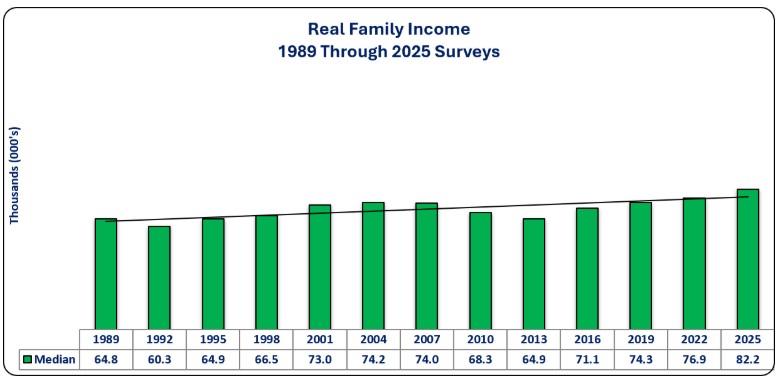
Even though the median income rose 6.9% between the 2022 and 2025 surveys, the gains were not evenly distributed. With all the discussion about the K-shaped economy, it may surprise you that the top 20% of income earners experienced a decrease in median real income between the 2022 and 2025 surveys. Drilling a little deeper into the data shows that the top 10% of income earners suffered the biggest decrease in their median real income with a 6.5% decrease. The “middle” (40-60th percentile) experienced the biggest gain at 6.7%. The income gap narrowed but remains substantial as the table below illustrates.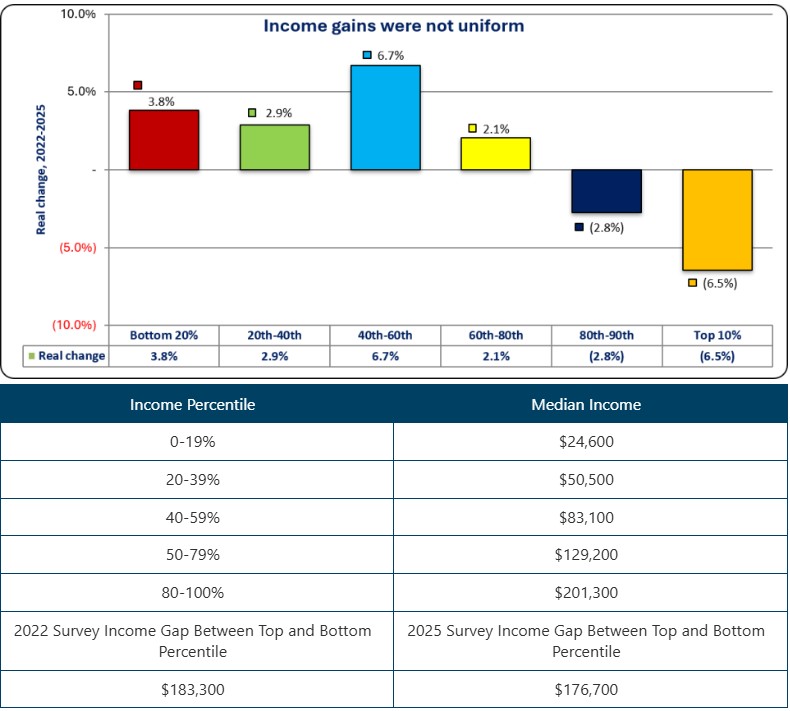
Assets
Examining the chart below reveals that the fastest rising trend is families that own retirement accounts. This may well be due to the change in 401(k) rules since 1989 that allows a company to automatically opt-in new employees into the company 401(k). The percentage of families that own a house has risen from the 1989 survey, but the trend is basically flat. The percentage of families that own a house rose by 1.7 percentage points, while ownership of retirement accounts increased by 17.8 percentage points, and the percentage owning stocks rose 24.2 percentage points. The unanswered question is: are more families owning stocks because of a thoughtful asset allocation decision or because of fear of missing out on the growth of stocks without consideration for whether they are financially positioned to withstand the volatile swings of stock prices?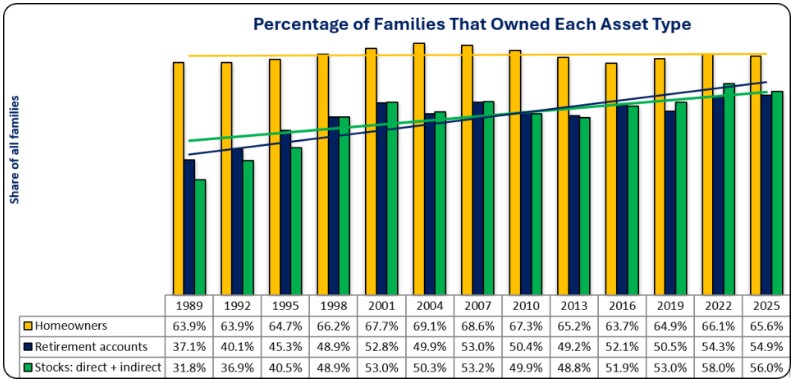
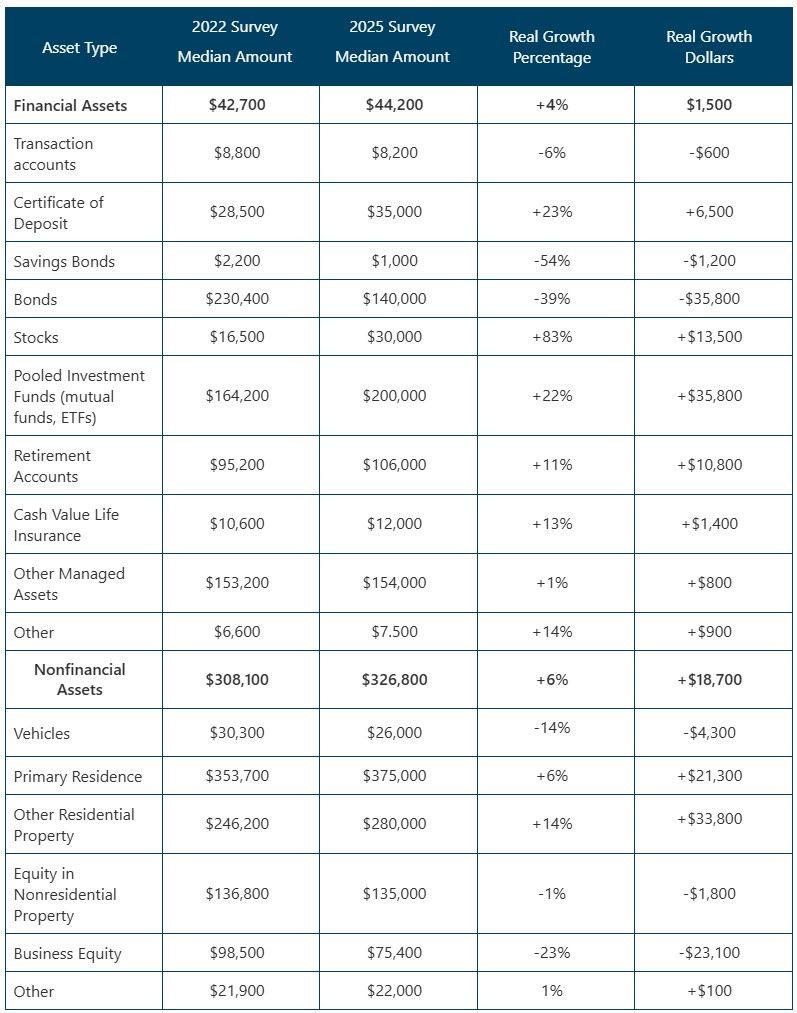
The table below shows the real growth of all the asset categories in the survey. Several points to note:
-
Asset growth was selective, not universal, as 10 asset types gained and 6 lost value.
-
Since percentages can be distorted by the size of the asset, it is important to understand that even though stocks experienced the highest percentage growth at 83%, it was only $2,000 ahead of the Other Residential Property category which “only” showed 14% growth.
-
It is curious that individual bond holdings fell by the same dollar amount as the gain in mutual funds and ETFs (pooled investment funds). Without direct evidence, the implication could be that families shifted out of individual bonds into mutual funds and ETFs. Even if that is true, it does not mean that all the move out of bonds into bond mutual funds, especially given the rise in stocks (direct and indirect holdings).
-
Owners of private residences may be pleased with a 6% appreciation of their home, but that did not help the first-time home buyer wanting to buy a house. The other frustration for first-time home buyers is the fact that the Other Residential Property rose by 14%. Other Residential Property is second homes and rental properties. There is not much incentive for the owner to sell that property (and potentially make it available for a home buyer) if it provides solid appreciation.
-
The fact that the Private Business Equity category decreased in value may be evidence that small businesses suffered over the survey period and losses reduced their equity in their business.
Debt
Examining the trends lines from the graph below shows that, for three out of the four categories, even though the percentage rose since the 1989 survey, the trend was essentially flat. The outlier is the rising trend for student loan debt. There has been a significant increase in the percentage of families that currently hold student loan debt compared to the 1989 survey. Over the shorter period between the 2022 and 2025 surveys, the data shows the percentage of families holding debt-for all categories-declined. Credit card debt is the most widely held debt at 44.7%. 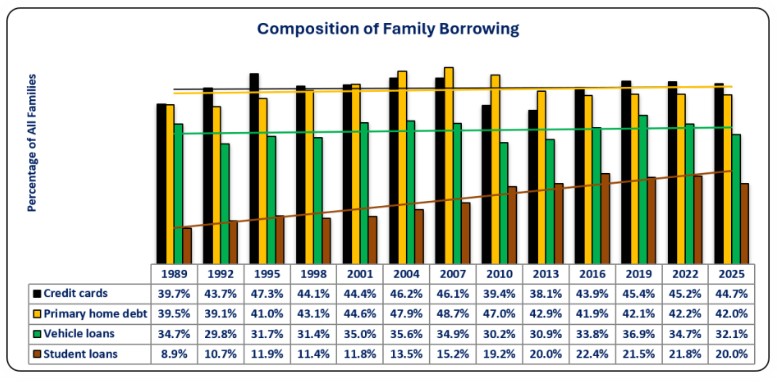
If we examine each category of debt to see which one had the biggest growth, the data shows debt secured by residential property had the biggest rise. Primary house debt grew 7.9% while other debt secured by residential property (i.e., home equity lines of credit) grew 11.3%. Other fixed rate installment debt (including buy now-pay later loans) experienced the biggest decline between the 2022 and 2025 surveys.
The table below the graph gives perspective on the dollar change in debt versus the graph showing the percentage change.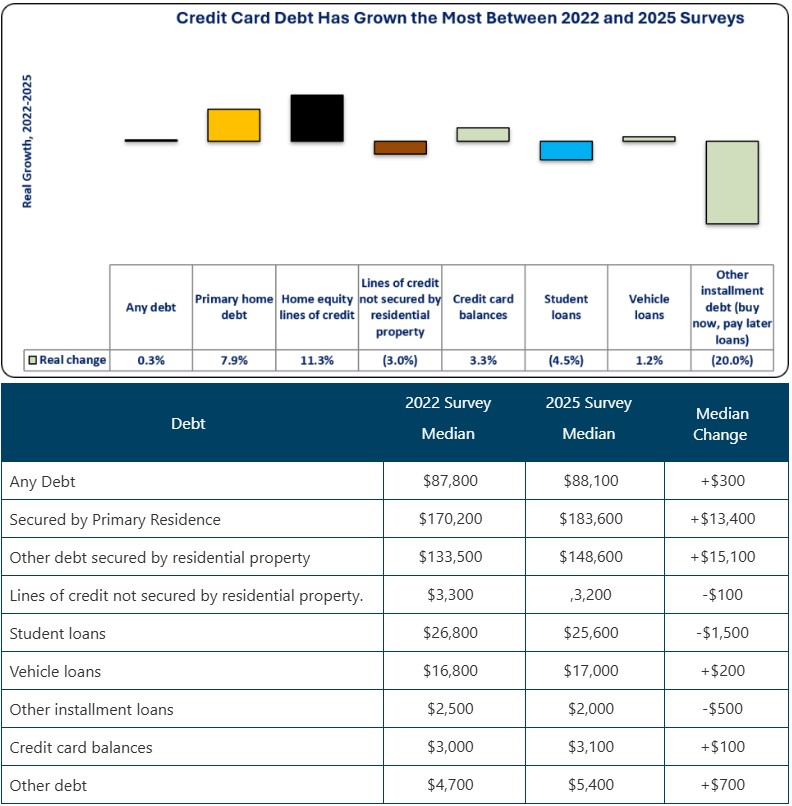
Net Worth
Now let us examine changes to family wealth. The trend for wealth is also rising, but the drop from the Financial Crisis was more severe as the housing market was hard hit during the recession. Since the 1989 survey, median real family wealth grew 82.8%, while the change between the 2022 and 2025 surveys showed a 2.3% increase. We have to treat the modest increase with a bit of perspective since there was a significant increase between the 2019 and 2022 surveys. During that period, net worth grew 36.7%. That is 44% of the 82.8% total growth in one survey period. It appears that the combination of monetary policy tax cuts and fiscal stimulus and the Federal Reserve's monetary policy of suppressing interest rates resulted in strong growth in assets, primarily stocks and real estate. 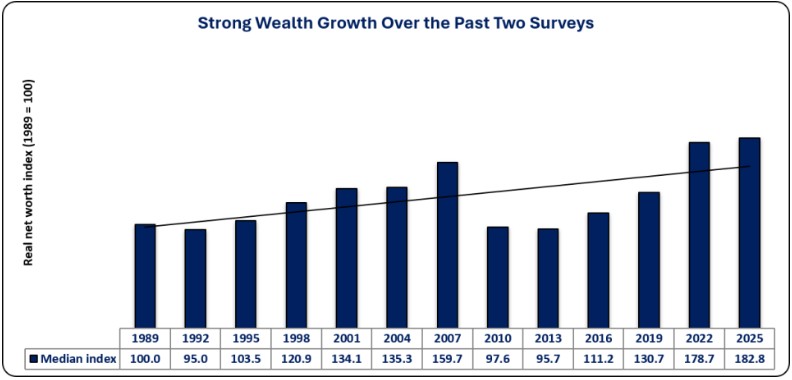
Even though the 2022 through 2025 results show modest growth, beneath the surface there were large differences. As the graph below illustrates two views:
-
Homeowner versus renter
-
Age
When examining a homeowner vs renter view, the K-shape is very clear. Those who owned a home experienced growth in the value of that asset, while those who rented did not own that type of asset. Homeowners have a median net worth of $458,900 compared with $10,600 for renters. On top of that, the median wealth for homeowners rose 5.8% since the 2022 survey while the median wealth of a renter fell 7.0%. When examining by age, what stands out is the significant increase in wealth of the 75+ age group. This is most likely the case that this age group has paid off much of their debt while their assets continue to grow. 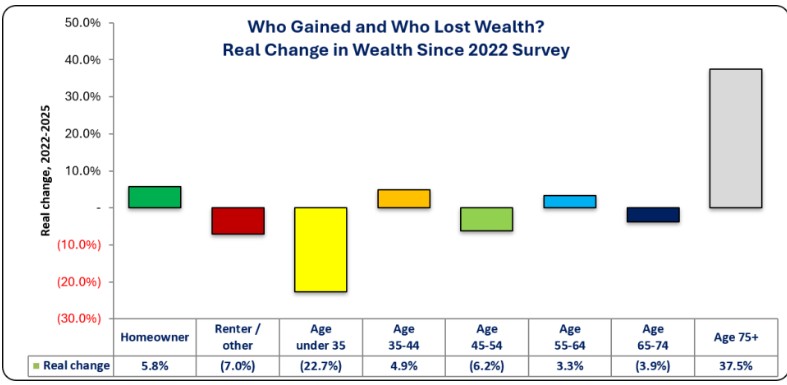
Financial Vulnerability
The Federal Reserve track financial vulnerability through three metrics: late payments, leverage, and payment pressure. That data for these series goes back to the 2013 survey. The first graph examines trends in two forms of late payments: any payment that is past its payment date and any payment that is more than two months past its payment date. The graph illustrates that a higher percentage of families are reporting being past due on their payments. There is clearly a rising trend for any payments that are past their due date, but a far smaller upward trend for payments more than two months past due.
It is concerning to see how strongly any form of late payments rose in the 2025 survey. The median percentage reporting late payments rose by 7.4 percentage points. Both the Any Late Payment and Late 2+ Months categories are at levels higher than the four previous survey periods.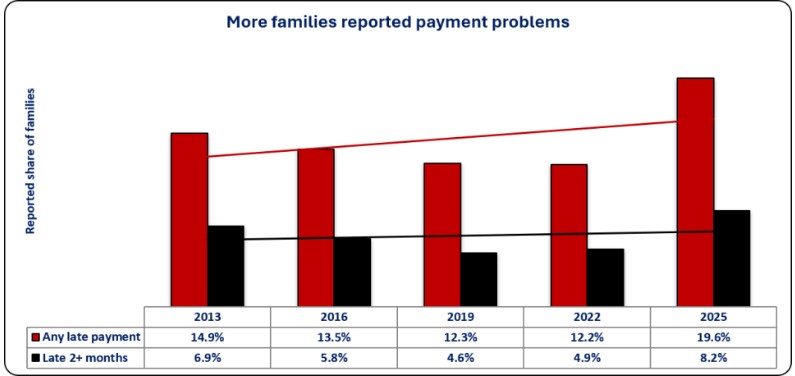
The following graph examines the debt-to-assets ratio and the payments-to-income ratio. The debt-to-assets ratio calculates the value of outstanding debt as a percentage of the value of assets. The payments-to-income ratio calculates how much of a family's income is consumed making their debt payments.
What the graph illustrates is that rising asset values do not necessarily mean that it is easier to make debt payments. The median debt-to-assets ratio has steadily fallen from the 2013 survey to the 2025 survey. In contrast, the payments-to-income ratio has fluctuated between each survey. The 2025 survey is lower than the 2013 survey, but higher than the other three surveys.
Digging a little deeper into the data reveals that 8.6% of families devoted more than 40% of their before-tax income to debt payments in the 2025 survey. This is up from 6.5% in the 2022 survey.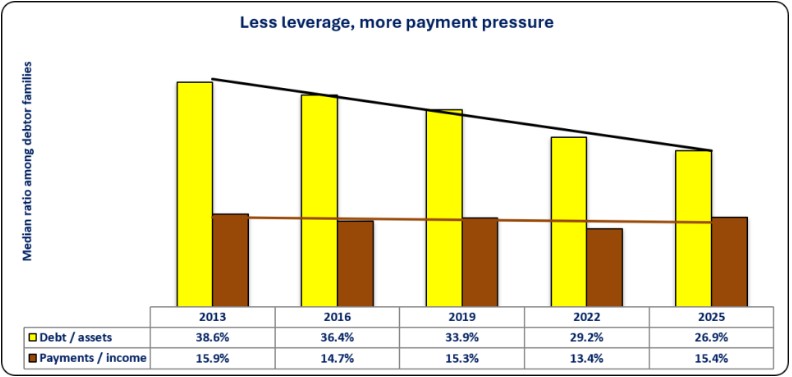
Closing Thoughts
-
The Federal Reserve survey provides further evidence of the K-shaped economy as the data does not provide any evidence that consumers are uniformly healthy or unhealthy.
-
Not all American families have experienced an increase in wealth and purchasing power.
-
The income gap narrowed between the 2022 and 2025 surveys but remains substantial.
-
As of the 2025 survey, the biggest winner for wealth accumulation was the 75+ age bracket at 37.5% and the biggest loser was the under 35 age bracket at -22.7%. They may help explain the polls that show the younger generations support the concept of a wealth tax.
-
-
Financial vulnerability has increased as the percentage reporting late payments has deteriorated since the 2022 survey and the payments/income rate has worsened.
-
Higher real income is what is needed to support spending. Higher wealth provides a buffer but not immediately spendable income.
-
Growing wealth (i.e. your assets) does not necessarily mean that it is easier to pay your monthly bills (i.e. your income).
Disclosures

Steve is the Economist for Washington Trust Bank and holds a Chartered Financial Analyst® designation with over 40 years of economic and financial markets experience.
Throughout the Pacific Northwest, Steve is a well-known speaker on the economic conditions and the world financial markets. He also actively participates on committees within the bank to help design strategies and policies related to bank-owned investments.