




Summary
After seeing the headlines on the July jobs report, some may decide that it is time to let the hand wringing and worrying begin. The Bureau of Labor Statistics (BLS) released its monthly Employment Situation Report for July, and the headline results were not good. The nation lost 22,900 jobs in July. More importantly the trend of downward revisions for the previous two months continues. The BLS revised June lower by 37,000 and May lower by 66,000. The positive news beneath the headlines is that 10 industry sectors added jobs while 6 lost jobs. Those people that were employed experienced a 3.5% average year-over-year growth in average weekly wages. July's jobs report puts the Federal Reserve in a difficult situation as the trend for jobs growth is falling while inflation remains well above its target rate of 2.0%.
Establishment Survey
Analyzing the data shows that the Healthcare & Social Assistance industry sector continues to be the leader in jobs growth for the 10 industries that added jobs. The Government and Leisure & Hospitality industry sectors experienced the biggest job losses. Within the Government sector, local government education (public K-12 and college) led the losses. This sector lost 50,000 of the 53,000 of the government job losses. Food Services & Drinking places accounted for 26,100 of the 40,000 Leisure & Hospitality job losses.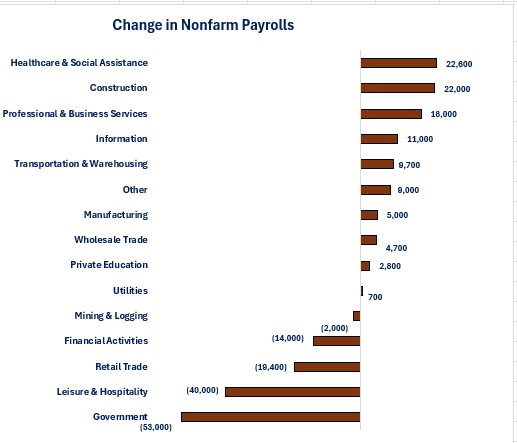
For the year-to-date, the average job creation sits at 45,429 per month. Examining the year-to-date data shows that the Healthcare & Social Assistance industry sector dominates jobs growth. Two industries-Healthcare & Social Assistance and Professional & Business Services-accounted for over 100% of total jobs created this year while the Leisure & Hospitality, Financial Activities and Government industry sectors have all lost jobs.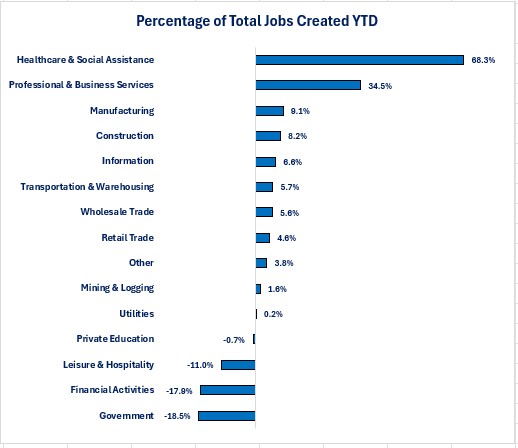
The news was better for employees as average weekly earnings rose 3.5% on a year-over-year basis. Unfortunately, not all employees saw that level of increase. The industry creating the most jobs-Education & Health Services experienced the lowest year-over-year wage growth, while the industry-Utilities-that experienced the smallest jobs growth had the highest year-over-year wage growth. This dynamic may help explain the negative sentiment of the average consumer since many may not be seeing wage increases sufficient to offset price increases. Employees were not able to increase their income via working more hours as the average hourly work week remained at 34.3 hours.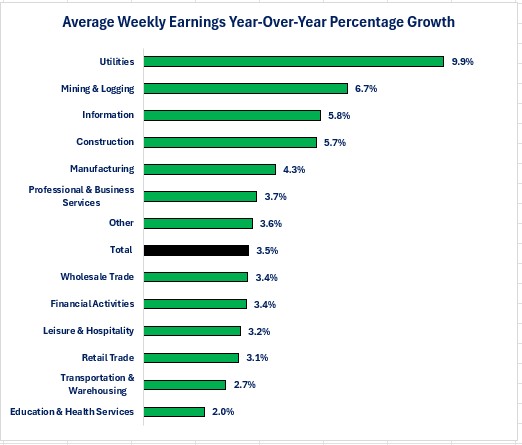
The wage gap continues to grow as the highest paying industry sector is also seeing the higher wage gains. The problem is that the three highest paying industries are the three industries with the lowest number of total jobs while the three lowest paying industries employee a far higher number of employees.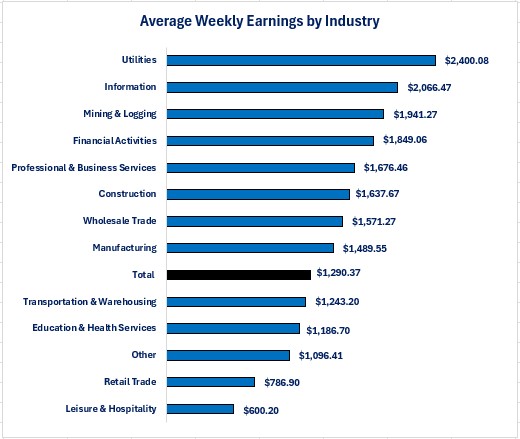
Household survey
The Household Survey showed a similar result compared to the Establishment Survey. The Household Survey reported the number of employed people fell by 87,000 while the number of unemployed people rose by 178,000. Even with those results, the unemployment rate fell from 4.3% to 4.1%. This is because the labor force shrank by 264,000 and the number of people not in the labor force (i.e., not actively seeking employment) rose by 381,000.
If we examine these data points by race or ethnicity, we learn that two categories suffered the most. The graph below shows the Asian and Black or African American categories both experienced declines in the number of people employed and in the labor force. These two categories also experienced the biggest increases in people not in the labor force. The Hispanic or Latino category showed the strongest increase in employment and the biggest decrease in the number of people not in the labor force. The White category also experienced growth in employment and labor force and decreases in unemployment and people not in the labor force.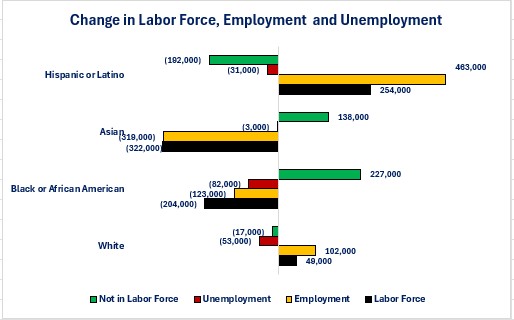
What the data does not tell us is why people are dropping out of the labor force. Is it because of retirement, illness, disabilities, taking care of family members or simply giving up looking for work? One piece of data that may be connected to this question is the data on the length of unemployment. What that data showed was that the average duration of unemployment fell from 25.5 weeks to 24.9 and the percentage of people unemployed for 27 weeks or more fell from 27.3% to 25.5%. The data shows that the number of people unemployed for 27 weeks or more fell by 166,000. This may be because long-term unemployed people have simply given up looking for work and dropped out of the labor force.
The number of people working part-time for economic reasons rose by 123,000 in July and in a potential sign of financial stress, the number of people working multiple jobs rose by 139.000. This resulted in the number of people working multiple jobs rising to 5.4% of total employed. This percentage has risen from the 5.0% that existed at the end of 2025.
Conclusions
-
The July jobs report was clearly negative and the concerning trend is that the revisions to previous month's data continue to be downward.
-
The average employee experienced a solid 3.5% year-over-year wage growth, but that growth rate was not universal among all industries. The industry creating the most jobs had the lowest average wage increase.
-
The results from the jobs report does not match the growth that is occurring in the economy. Current forecasts are for 3rd quarter economic growth to be close to 2%.
-
The unanswered question is this: are businesses achieving efficiencies that are resulting in being able to do more with less employees or is this a case that, due to the decline in the labor force, businesses are unable to fill a position if an employee quits or retires, thus resulting in a job loss (i.e. unfilled position)?
-
-
July's Employment Situation Report puts the Federal Reserve in a difficult situation since the employment picture shows a downward trend while inflation remains well above the 2% target rate.

Steve is the Economist for Washington Trust Bank and holds a Chartered Financial Analyst® designation with over 40 years of economic and financial markets experience.
Throughout the Pacific Northwest, Steve is a well-known speaker on the economic conditions and the world financial markets. He also actively participates on committees within the bank to help design strategies and policies related to bank-owned investments.