



Summary
The nation received a dose of good news as the Bureau of Labor Statistics (BLS) reported a 165,000 increase in jobs in October. This far exceeded the 65,000 increase forecasted by economists surveyed by Bloomberg. Jobs growth remained concentrated as two industries accounted for 76% of the total growth.
On average wages kept up with inflation as the average weekly earnings rose 3.7%. More of the working age population was in the labor force as it increased 128,000. As a result, the labor force participation rate rose. The BLS reported the number of employed people rose while the number of unemployed fell. As a result, the unemployment rate declined from 4.2% in September to 4.1% in October.
It was not all good news as the average duration of unemployment rose from 24.8 weeks to 27.1 weeks. The percentage of people who have been unemployed for 27 weeks o more rose from 27.1% in September to 27.6% in October. October's solid jobs growth combined with continued high inflation levels may well result in the Federal Reserve raising its overnight borrowing rate at its December meeting.
Analysis
Total jobs growth in October was 164,900 (rounded to 165,000 in the official report). The BLS also revised the past two months' data up. The August data was revised from +133,000 to +186,000 and September's data was revised from 29,000 to 60,000.
As the first chart below illustrates, there is a clear bifurcation in jobs growth. Jobs growth was concentrated in two industries. Professional & Business Services and Healthcare & Social Assistance accounted for 76% of total jobs growth in October. Eight industry sectors added jobs while six lost jobs.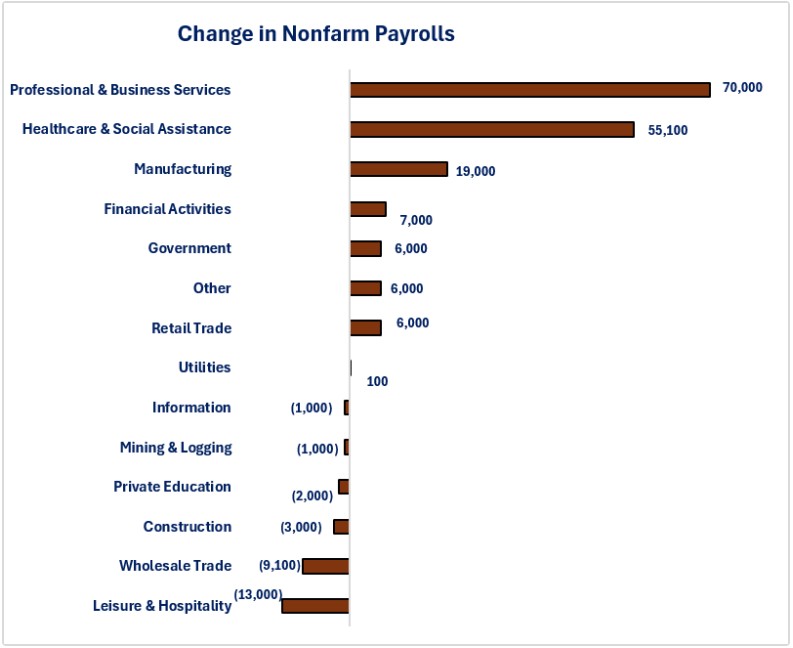
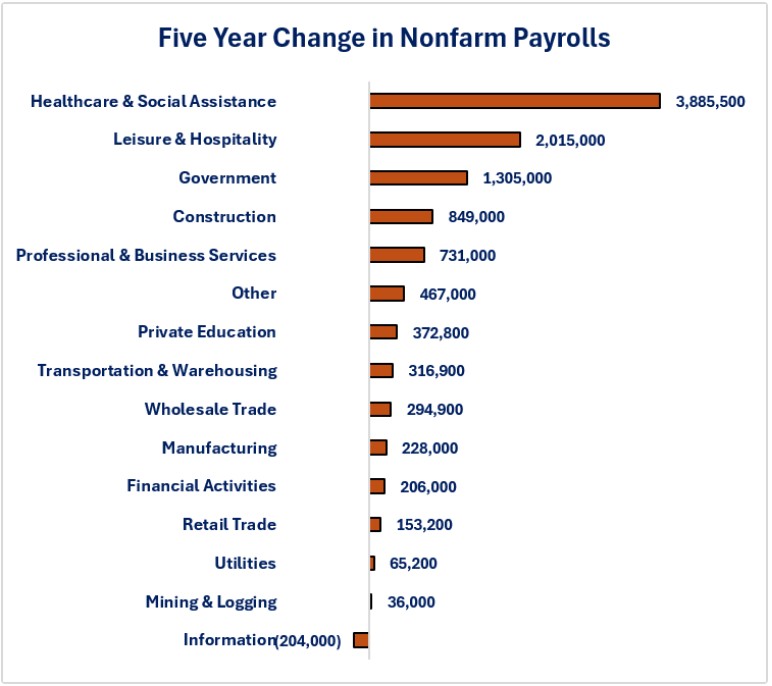
Bifurcated jobs growth was not just an October phenomenon. As the graph below highlights, jobs growth has been bifurcated and concentrated for the past five years.
Over the past five years, the Healthcare & Social Assistance and Leisure & Hospitality industry sectors accounted for 55% of total jobs growth and the industry that was viewed as the “hot” industry (Information) lost jobs.
As many in the technology world have learned, the rapid jobs growth during the pandemic period has now evaporated and layoffs are now being announced regularly by the major technology companies.
As you can see from the graph below, the top three industry sectors currently account for 43.9% of total jobs and bottom three account for 2.5%.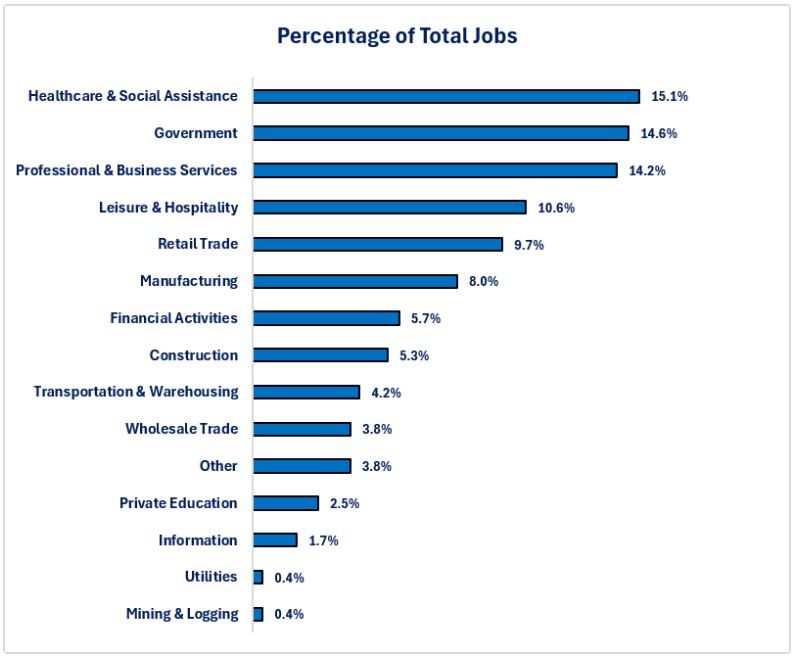
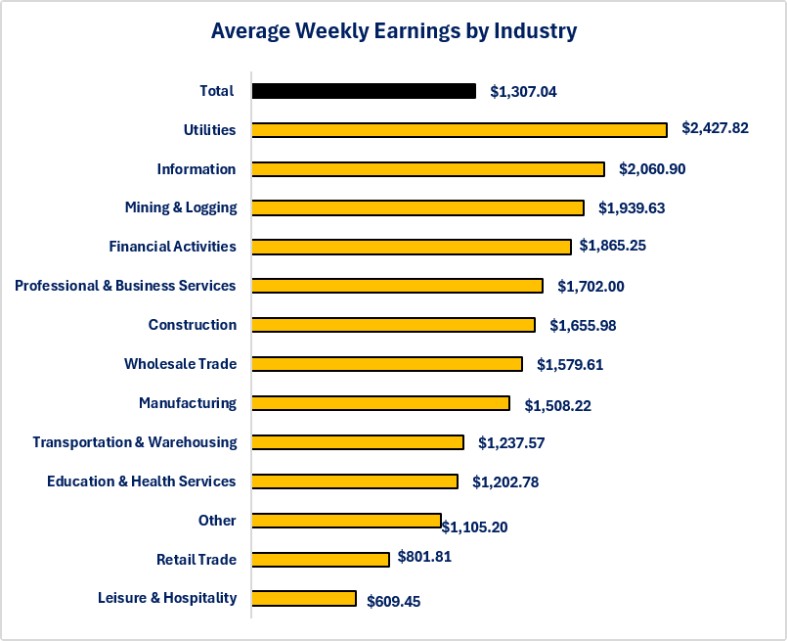
There is also a clear bifurcation in the wage structure for the US. The current gap between the top paying industry (Utilities) and the lowest paying industry (Leisure & Hospitality) is $1,818.37 per week.
The average Utility worker makes almost four times the wage of a Leisure & Hospitality worker. The reality Utility sector is the second smallest industry sector for total jobs (Mining & Logging is the lowest) while Leisure & Hospitality is the fourth highest.
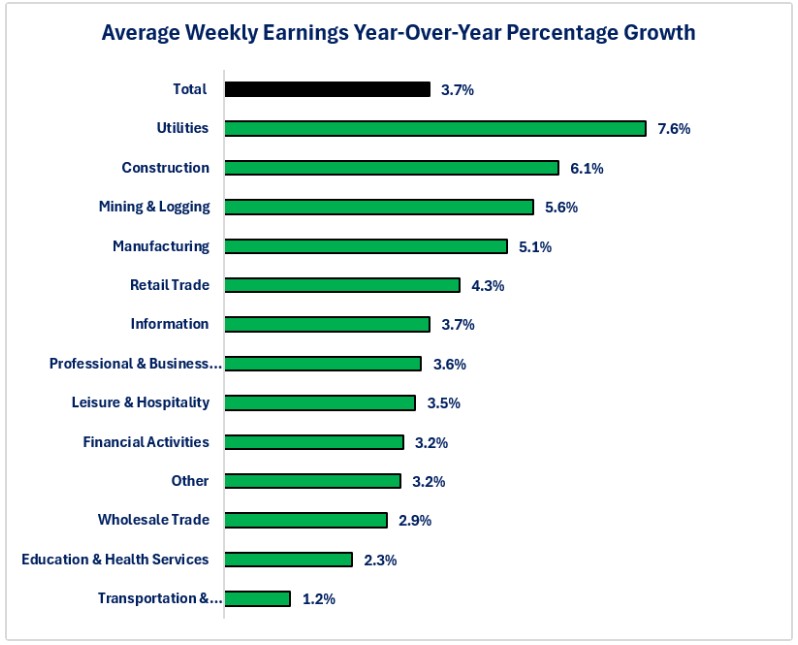
From a wage growth perspective, the average worker managed to stay even with inflation as average weekly earnings rose 3.7%. Unfortunately, it was not a universal 3.7% growth. The highest paying industry also experienced the highest year-over-year wage growth at 7.6%.
The industry that has added the most jobs over the past five years (Education & Health Services) and the second highest jobs growth in October only experienced a 2.3% growth rate.
There is also a clear difference in the unemployment rate when you examine it by educational attainment. Even though the overall unemployment rate was 4.1%, there is a wide disparity depending on level of education.
The unemployment rate for those with less than a high school diploma surged from 4.3% to 5.8%. This was primarily because more of the population with that education level entered the labor force seeking work. This can be seen by examining the second graph.
As the second graph shows, the labor force participation rate saw the biggest percentage point improvement for those with less than a high school education. Those with a bachelor's degree or higher continue to have the lowest unemployment rate and the highest labor force participation rate.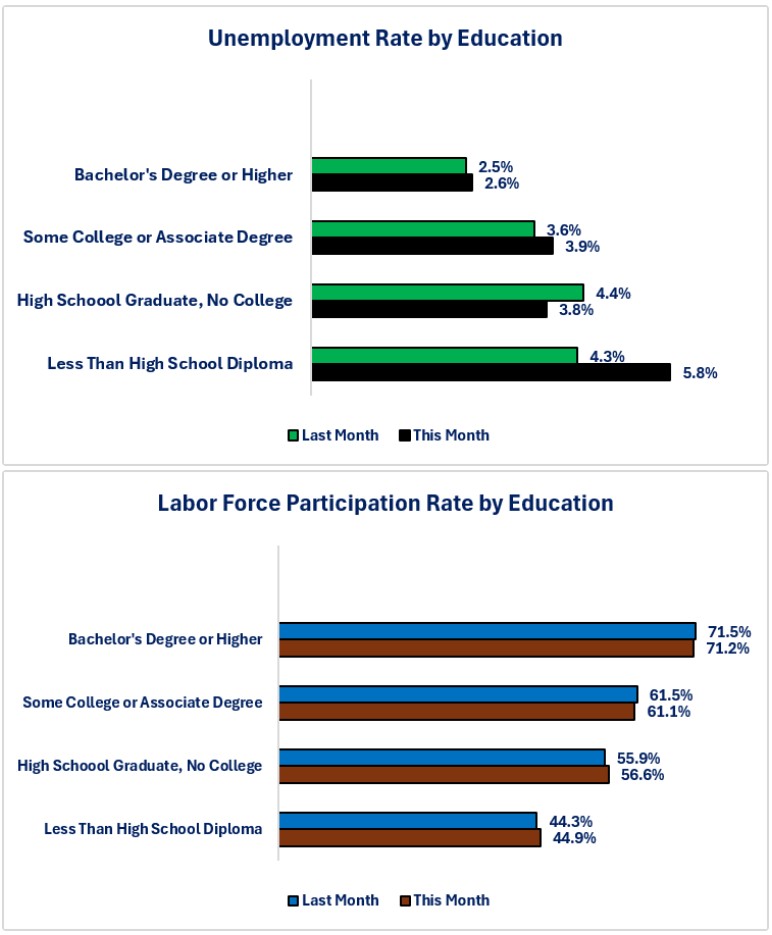
For those who were already unemployed, the news was not encouraging. The average duration of unemployment rose from 24.8 weeks to 27.1 weeks. The percentage of people who have been unemployed for 27 weeks or more rose from 27.1% to 27.6%.
Conclusions
-
October's jobs reported may temporarily put to rest the worry that jobs growth was deteriorating.
-
Upward revisions to the two previous months solidified the picture that jobs are still being created, but at a slower pace than what existed pre-pandemic.
-
The Employment Situation Report highlights the fact that jobs side of the economy is a bifurcated story with clear differences in jobs creation, wages, and unemployment levels.
-
Even though October's jobs results are solid, borrowers may not view that as good news since it could result in the Federal Reserve raising its overnight borrowing rate at its December meeting.
Data Source

Steve is the Economist for Washington Trust Bank and holds a Chartered Financial Analyst® designation with over 40 years of economic and financial markets experience.
Throughout the Pacific Northwest, Steve is a well-known speaker on the economic conditions and the world financial markets. He also actively participates on committees within the bank to help design strategies and policies related to bank-owned investments.