




Summary
The Bureau of Labor Statistics (BLS) released its September Employment Situation Report, and the results re-emphasized a “low hire” environment for jobs creation. The nation added 29,000 jobs in September.
The Healthcare & Social Assistance sector dominated net jobs growth as it added 28,000 jobs. The Government sector suffered the biggest losses as it lost 17,000 jobs.
The unemployment rate rose slightly from 4.1% to 4.2% as more people entered the jobs market seeking work. This was evidenced by the labor force participation rate rising from 61.6% to 61.8%.
September's jobs data and the downward revisions to the previous two months raise the odds that the Federal Reserve holds off on another rate increase at its next meeting.
Analysis
The BLS reported 29,000 jobs were created in September which was far below the 82,000 median forecast from economists surveyed by Bloomberg. More importantly, it made a net revision of 60,000 less jobs created over the past two months. July was revised from 21,000 jobs added to a loss of 10,000 jobs. August's strong jobs growth was revised lower from 162,000 to 133,000. This continues to highlight the “low hire” jobs creation environment.
Establishment Survey
The jobs market highlights the “K-shaped” economy that many economists are using to describe US economic growth. As the chart below illustrates, out of the 14 industry sectors, nine added jobs while five reduced jobs. The Healthcare & Social Assistance sector leads the upward leg of the K-shaped jobs market. On a net basis, it accounted for 96% of total net jobs growth. The Government sector is the lowest part of the downward sloping portion of the K-shaped jobs market. It lost 17,000 jobs with the majority of those losses occurring at the state and local level, which lost 13,000 jobs.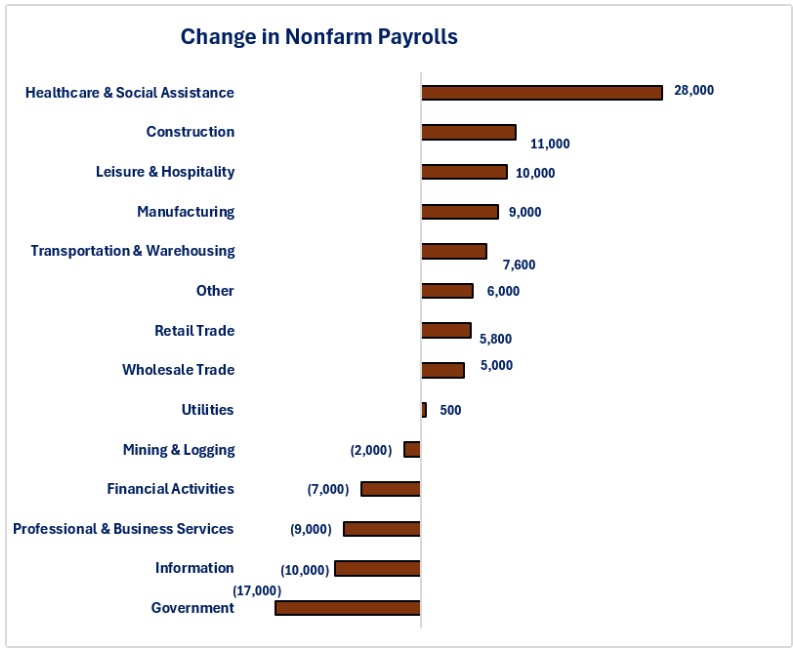
As the next chart shows, the Healthcare & Social Assistance sector comprises the largest share of total jobs in the US at 15.1%. Three sectors account for 43.9% of total jobs in the US. The three smallest sector comprise 2.5% of total US jobs.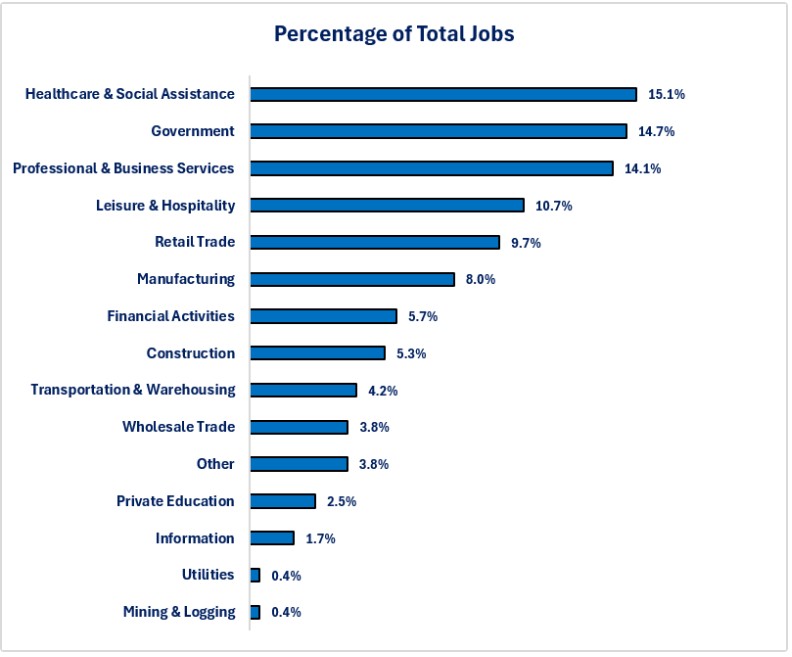
When examining wages, we also see the K-shape. Even though the overall year-over-year growth in average weekly earnings rose 3.6%, the range went from 2.1% to 7.0%. Two of the smallest industry sectors experienced the largest year-over-year wage growth. Unfortunately, the industry sector that is creating the most jobs (Healthcare & Social Assistance) experienced the smallest wage growth at 2.1%. The reality is that the sector driving jobs growth is not generating wage increases that keep pace with the official inflation rate.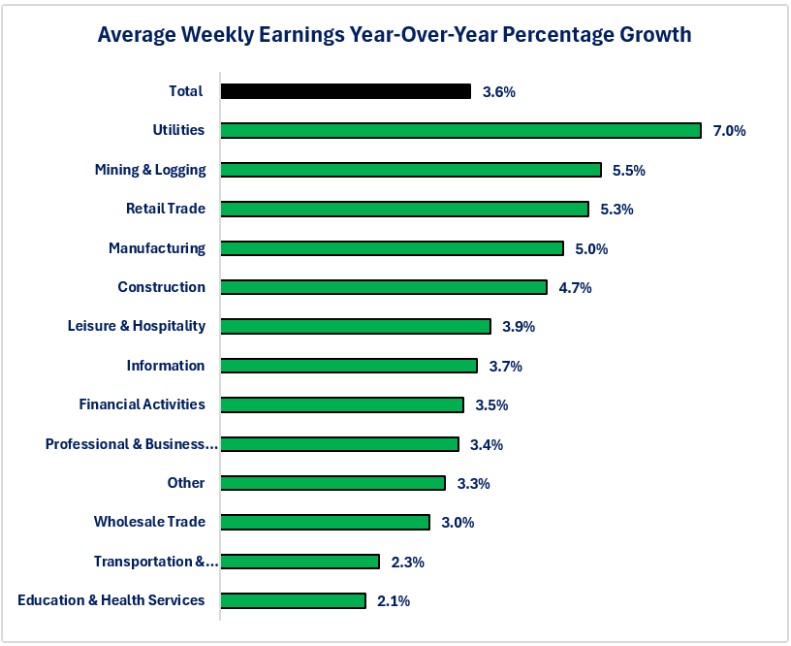
You can see from the graph below the wage average weekly earnings wage gap between the highest and lowest industry sectors. Given the difference in year-over-year wage growth highlighted in the previous graph, that gap is widening. The gap will organically widen if all industries receive the same wage increase since a 3.6% increase on an average weekly wage of $2,366.15 is a bigger dollar increase than a wage of $609.45. That gap worsens when the $2,366.15 wage receives a 7% increase while the $609.45 wage receives a 3.9% increase.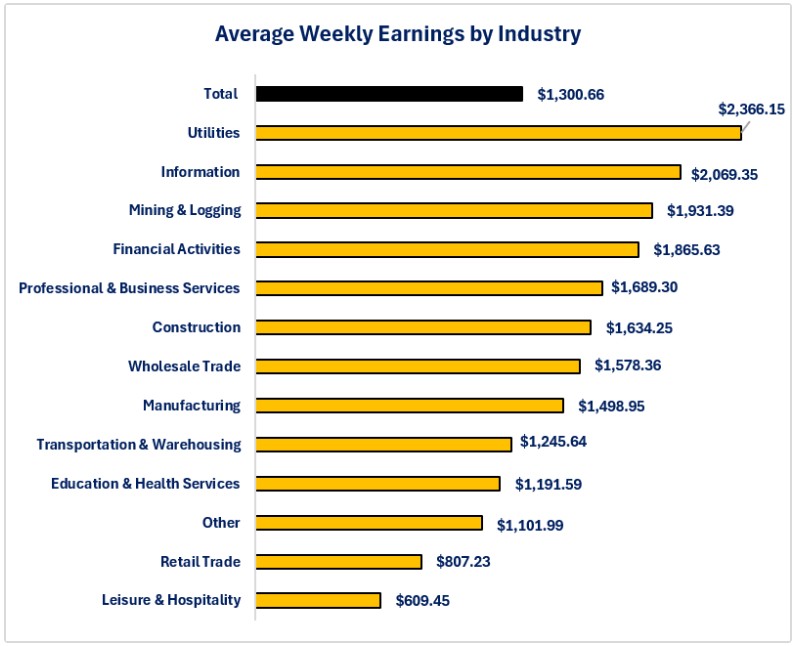
Household Survey
The results from the Household survey showed a 485,000 increase in the labor force. This is encouraging news for businesses looking to fill open positions. The Household Survey once again shows a large divergence for September compared to the Establishment Survey as the number of people reporting that they found a job and are employed rose by 406,000 while the Establishment Survey reports 29,000 new jobs created. The growth in the labor force resulted in the labor force participation rate rising from 61.6% to 61.8%. As the graph below shows, when examining the labor force participation rate by race/ethnicity, all groups experienced an increase in their labor force participation rate. The Black or African American group had the strongest improvement with a 0.9% increase from August, while the White group experienced the smallest increase at 0.1%.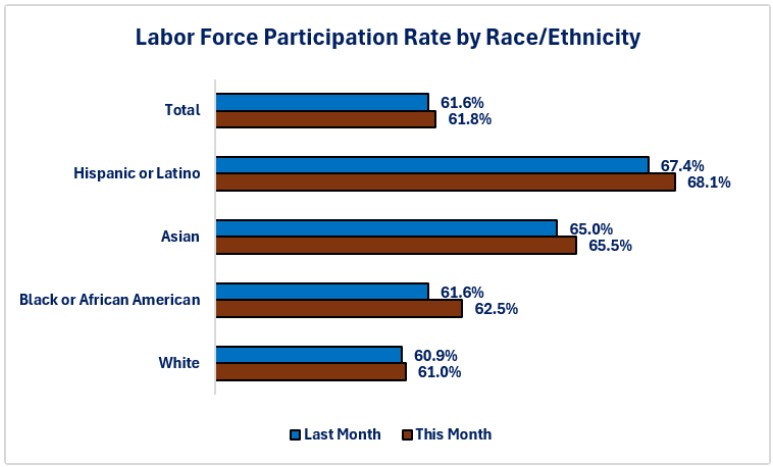
Unfortunately, the increase in labor force for the Black or African American group did not result in as many finding a job compared to those still looking for work. This can be seen in the graph below with the significant increase in the Black or African American unemployment rate compared to the other groups.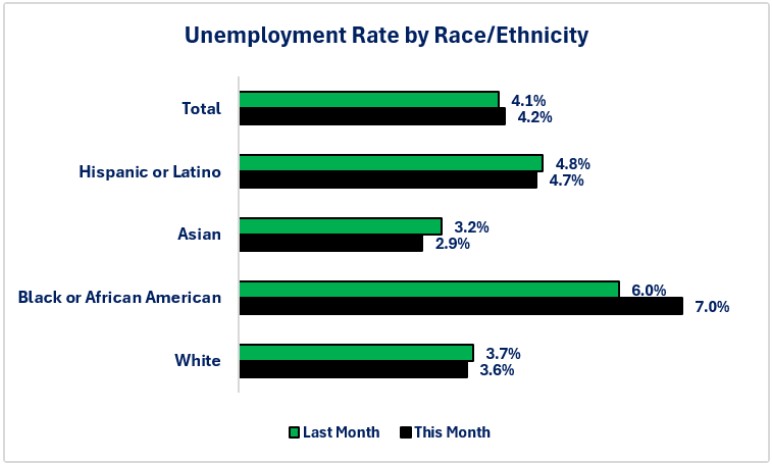
Signs of financial stress may be the reason for the percentage of total employed workers who are working multiple jobs rising from 5.4% to 5.5%. For those already unemployed, the average duration of unemployment fell from 26.3% to 24.8%. Given the low hire environment, this is most likely the result of some of the longer-term unemployed people giving up looking for work and dropping out of the labor force. The percentage of people who have been unemployed for 26 weeks or more rose from 27.0% to 27.1%.
Conclusions
-
The nation continues to create new jobs but at a far slower pace than what existed before the pandemic crisis.
-
What is not clear is how much of the job losses are the result of businesses being unable to fill jobs that become vacant since the initial jobless claims data does not show a rising trend of layoffs. Focus on increasing efficiency may be another reason for the slow job creation. That may include AI or new equipment that allows more to be done with less workers.
-
-
The jobs portion of the economy displays the “K-shaped” characteristics that are evident in other parts of the economy.
-
Perhaps part of the reason for the downbeat mood of the consumer is that jobs creation is occurring in the industry sector (Healthcare & Social Assistance) which continues to have some of the lowest year-over-year wage gains. If your wage gains are not keeping pace with your living expenses, you are most likely not going to give positive responses to surveys.
-
The slow pace of jobs growth raises the odds that they Federal Reserve may hold off on another interest rate increase until they see October's jobs results.
Data Source

Steve is the Economist for Washington Trust Bank and holds a Chartered Financial Analyst® designation with over 40 years of economic and financial markets experience.
Throughout the Pacific Northwest, Steve is a well-known speaker on the economic conditions and the world financial markets. He also actively participates on committees within the bank to help design strategies and policies related to bank-owned investments.